

Average Length of Rental for Repairable Vehicles: Q1 2017
As mentioned in previous updates, regardless of how the market is defined, there remains a significant delta between average and best in class.
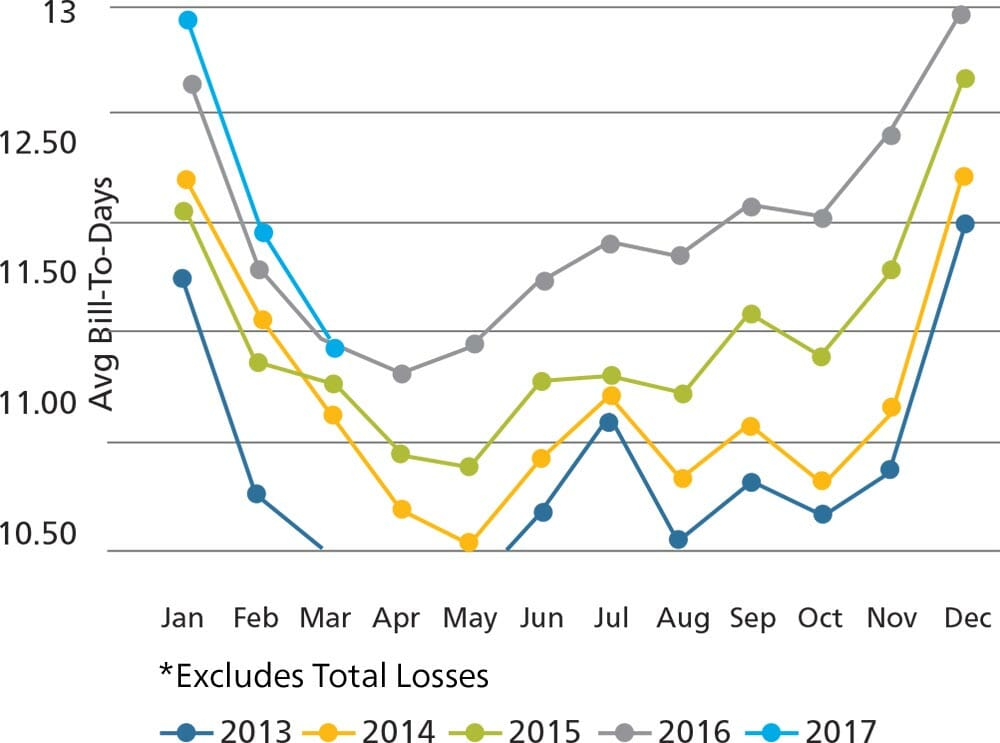
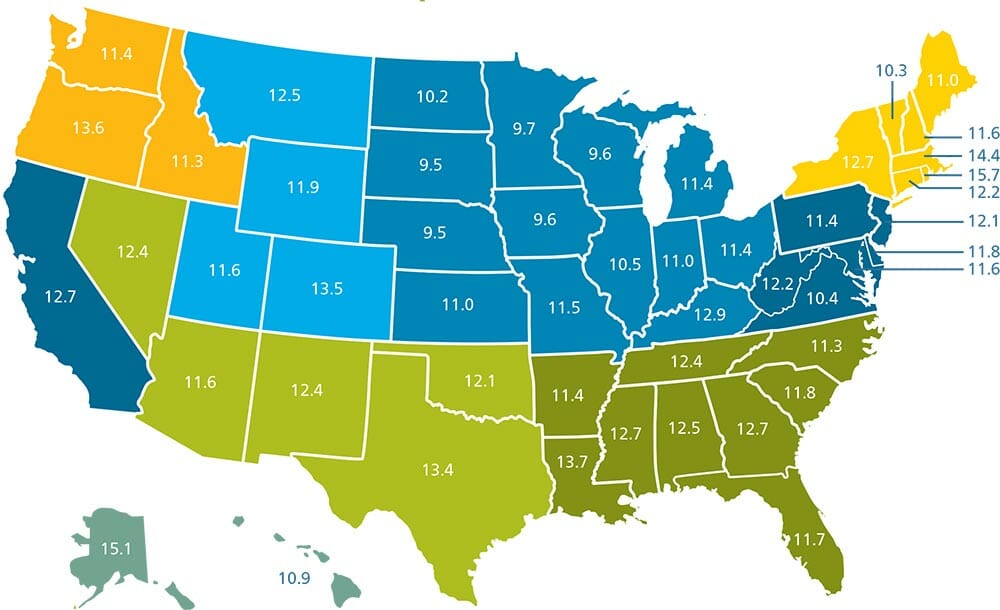
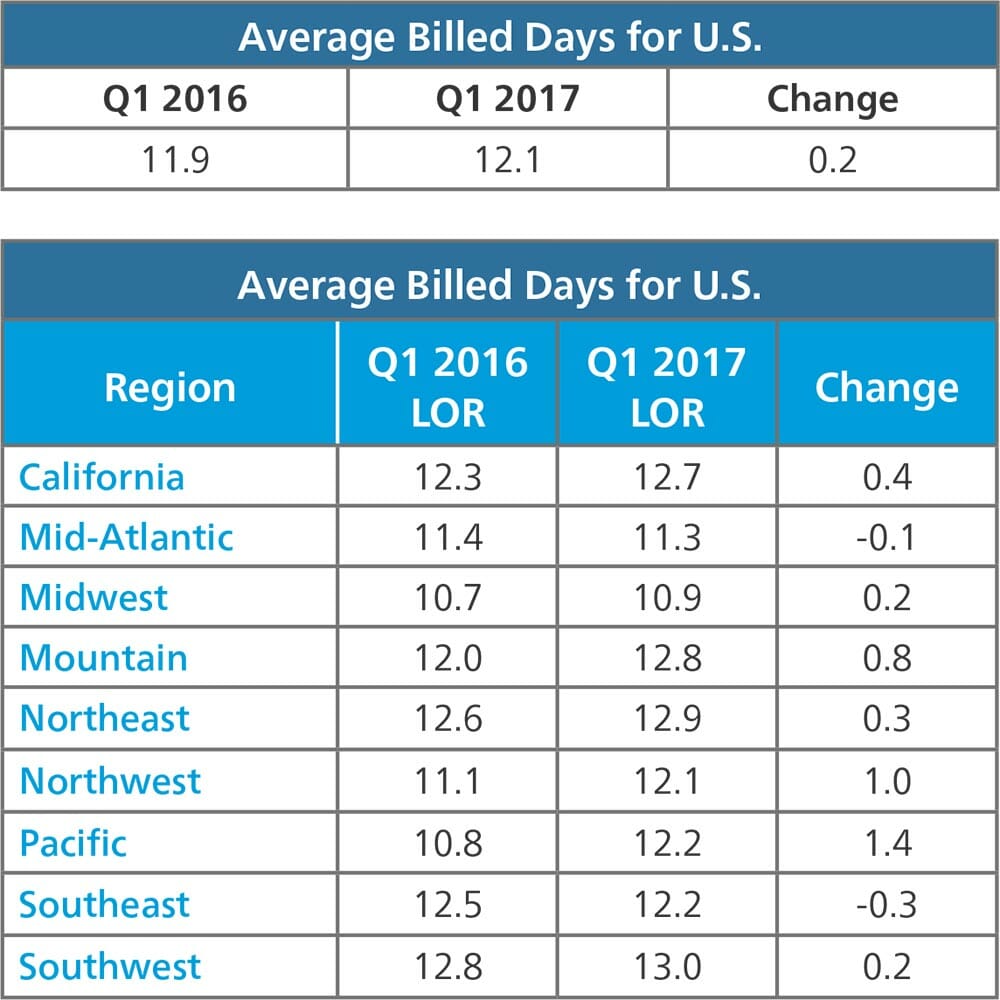
The rate of average Length of Rental (LOR) growth declined in Q1 of 2017 for the first time in multiple quarters increasing only a modest .2 days from 11.9 to 12.1. In March, the number was flat, the first month without a year over year increase in more than two years. The data demonstrates very little consistency across and within regions, therefore there doesn’t appear to be a true U.S. trend. Overall average LOR ranged from a high of 13 days in the Southwest to a low of 10.9 in the Midwest, while year over year change ranged from +1.4 in the Pacific (Alaska and Hawaii) to -.3 in the Southeast. For individual states, the range was 15.7 days in Rhode Island down to 9.5 in Nebraska, and a year over year change rate of +2 days in Alaska to -.5 in Florida.
Sixteen states produced results that deviated substantially from the U.S. average compared to just nine in the previous quarter. Florida, North Carolina, Nebraska, South Dakota, Georgia, West Virginia, Louisiana and Kentucky each experienced decreases of at least .3 days, although the final four states on the list did not drop enough to dip below the overall U.S. average of 12.1. Colorado, Oregon, Montana, Alaska, Minnesota, Maine, Idaho and North Dakota each experienced increases of at least a full day, although the last four states named remain below the overall U.S. average. Minnesota, in fact, was one of only five states below 10 days.
U.S. Average Length of Rental (LOR) by State Q1 2017
The data demonstrates very little consistency across and within regions, therefore there doesn’t appear to be a true U.S. trend.
While the rate of increase slowed, the core drivers of LOR (miles driven, claims frequency and repair complexity) remain in place and, as a result, we expect the previous few years’ historical trends to continue. It is worthwhile to note, however, that Q2 and Q3 of 2016 were significantly impacted by CATs in Texas and Colorado which could create a temporary deviation from the trend lines. As mentioned in previous updates, regardless of how the market is defined, there remains a significant delta between average and best in class. Shops that focus on building a culture of training, proper utilization of the ARMS® Auto Application and consistent execution of a robust scheduling strategy, routinely outperform market averages.
Canada
Canada saw its national Length of Rental (LOR) result increase .9 days from Q1 2016 to Q1 2017. Canada’s national LOR number for Q1 2017 was 11.7 days, compared to 12.1 days for our southern neighbour. Like the US, the data demonstrated significant variance across regions (provinces). This variance applied to both trends and actual results.
Canadian Average Length of Rental by Province Q1 2017
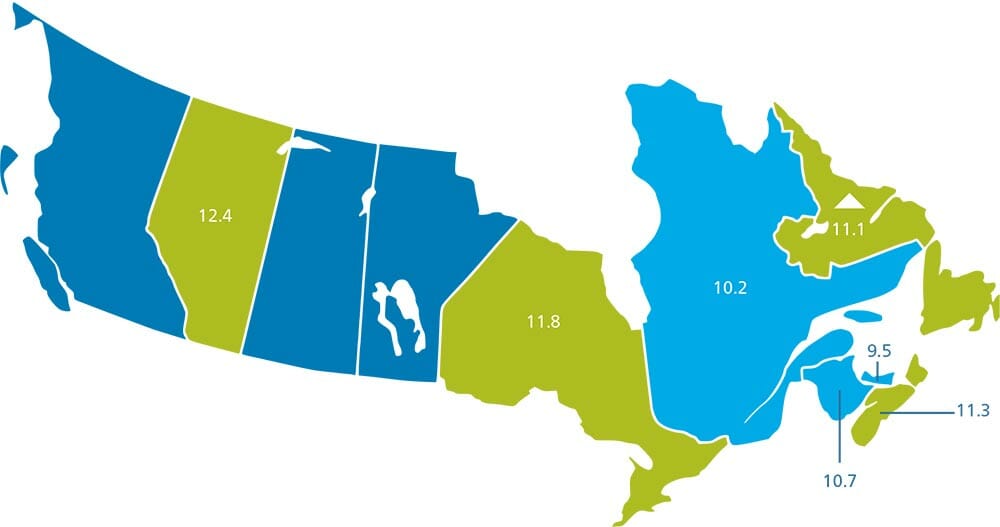
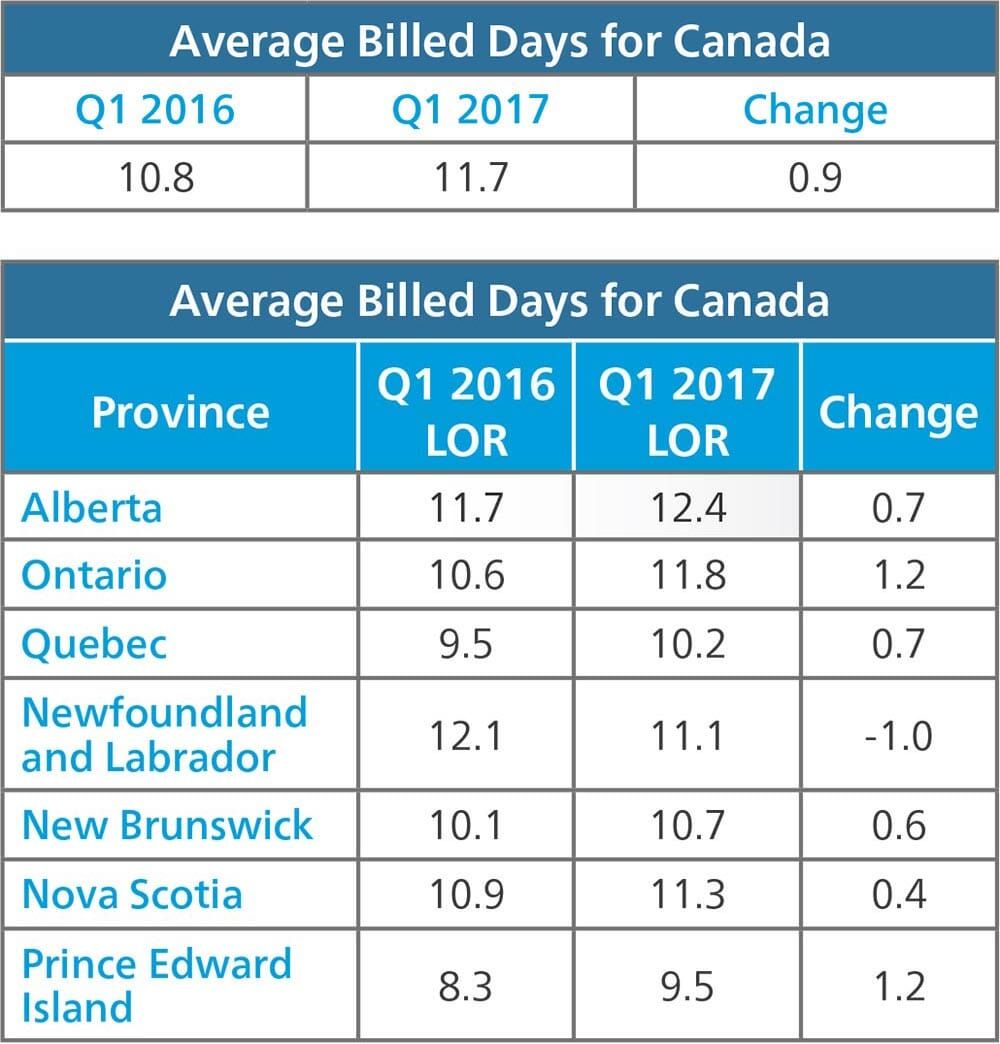
Overall LOR ranged from a high of 12.4 days in Alberta to a low of 9.5 days in PEI. Head to head, Alberta’s LOR results were 31% higher than PEI’s. Five of the seven private insurance provinces “beat” the Canadian average, including all four Atlantic provinces and Quebec. PEI finished the quarter with Canada’s lowest overall LOR, at 9.5 days. From a trend perspective, Newfoundland and Labrador led the way, with a 1.0 day decrease in LOR over 2016. Interestingly, this was the only province that improved (decreased) it’s LOR result over 2016, although Nova Scotia was close behind, with a marginal 0.4 day increase over 2016. On the other side of the scale, Ontario produced Canada’s largest LOR increase at 1.2 days. Owing to the distinction of being Canada’s most populous province, the increase in Ontario played a significant role in shaping Canada’s national trend result.

LOR trends have shown an increasing trend line over the past few quarters. Like the US, kilometers driven, claims frequency and repair complexity are the core drivers of LOR. Strong employment and relatively affordable fuel may be resulting in more driving by Canadians. Furthermore, this trend is linked with strong new car sales and their related repair complexity. 2016 was the fourth consecutive record year for Canadian new car sales, and the first time sales eclipsed 1.9 million. These strong trends continued into March, where abnormally wintry weather across Canada did nothing to cool down the record pace of new-vehicle sales. March new car sales in Canada grew 7.1% over March 2016, marking the third consecutive month of record sales volumes (source: Canadian AutoDealer). Canada also mirrors the US in that there remains a significant gap between “average” and “best in class” LOR results at the shop level. Shops that focus on building a culture of training, proper utilization of the ARMS® Auto Application and consistent execution of a robust scheduling strategy, routinely outperform market averages.
Year-Over-Year Change
Source: Enterprise Rent-A-Car. Includes ARMS® Insurance Company Direct Billed Rentals; Excludes Total Loss Vehicles. The quarterly LOR summary is produced by Dan Friedman, Assistant Vice President Collision Industry Relations and Sales at Enterprise Rent-A-Car. Dan has 21 years of experience with Enterprise working within the collision repair industry. Through its ARMS® Automotive Suite of Products, Enterprise provides collision repair facilities with free cycle time reporting with market comparisons, free text/email capability to update their customers on vehicle repair status, and online reservations. More information is available at armsautosuite.com or by contacting Dan Friedman at Daniel.Friedman@ehi.com.