

Average Length of Rental for Repairable Vehicles: Q2 2017
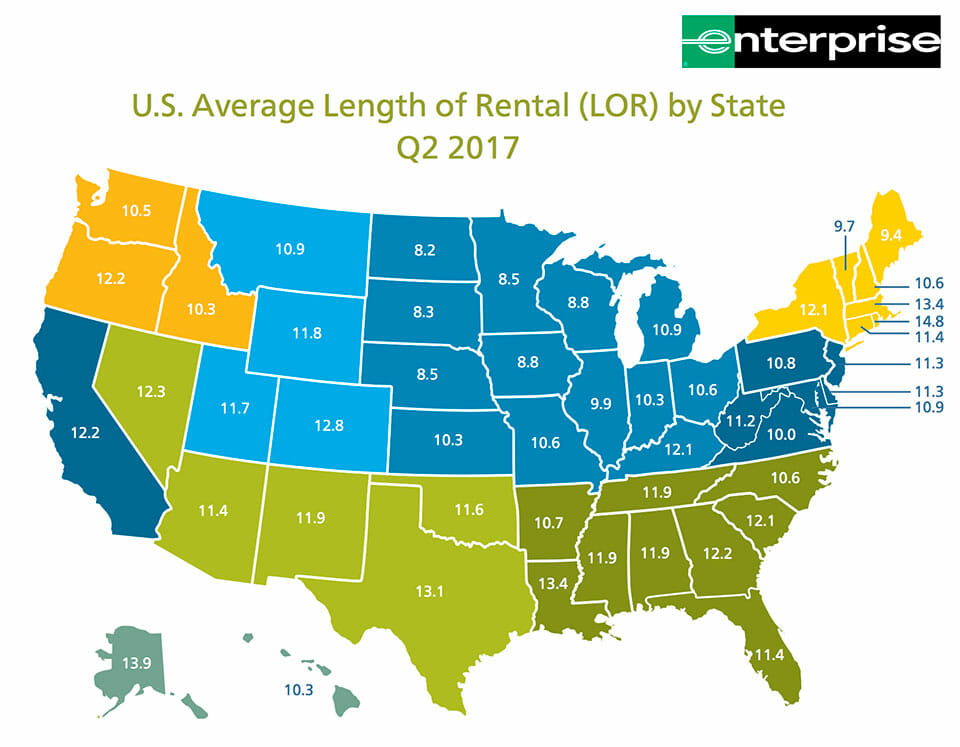
U.S. Length of Rental—Q2 2017
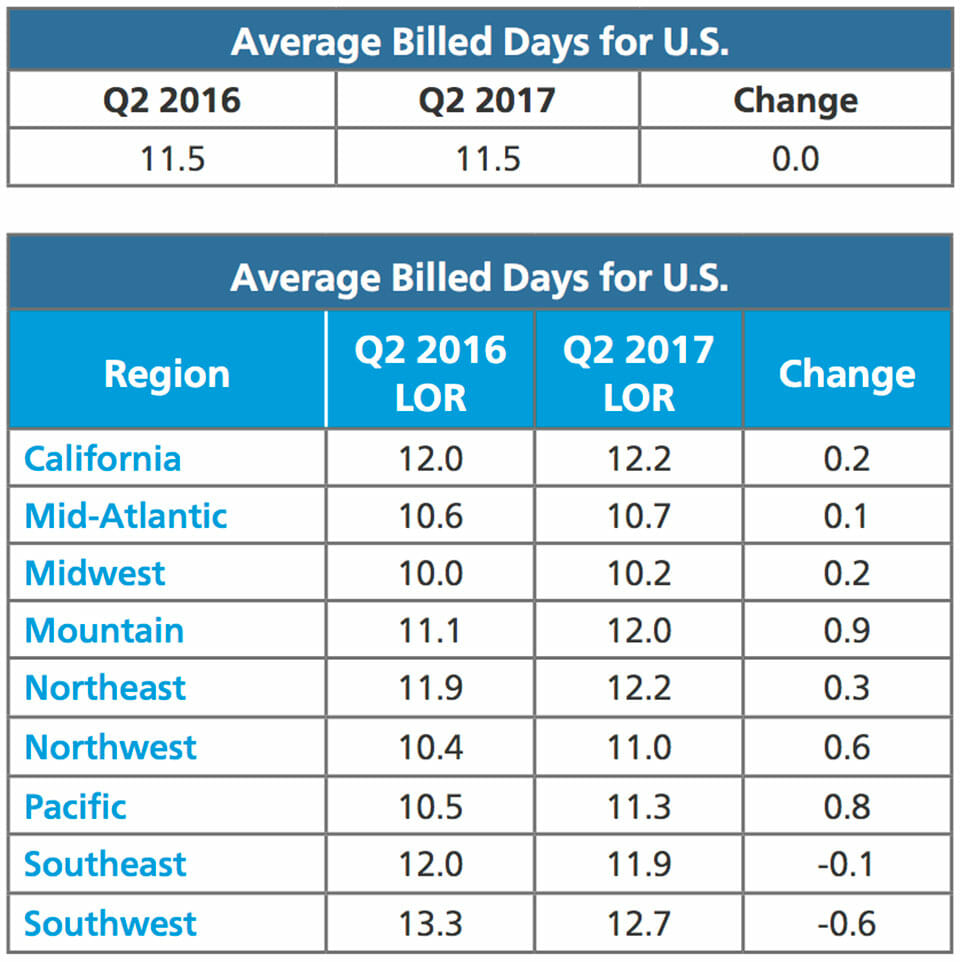
Average Length of Rental (LOR) in the 2nd Quarter 2017 landed at 11.54 days, representing only a fractional rise of .07 days versus the 2nd Quarter of 2016. This is a continuation of the trend we began to see in the 1st Quarter of 2017 when the rate of increase dipped to a multi-year low of .2 days. As with Q1, there was very little consistency between regions and states which suggests that the flat U.S. number is not reflective of a true national trend. While the Mountain and Pacific regions increased .9 and .8 days respectively, the Southwest declined -.6 days. For individual states, the largest increase was generated by Alaska (1.91 days) while the largest drop occurred in Texas (-.83 days). The delta for average length of rental ranged from a high of 12.7 days in the Southwest to a low of 10.2 in the Midwest. At the state level, the outliers were Rhode Island at 14.87 days and North Dakota at 8.77. At least 17 states deviated significantly from the U.S. in terms of year over year change, further demonstrating the lack of consistency. Alaska (1.91), Colorado (1.3) and Idaho (1.21) produced the largest increases although Idaho remained below overall U.S. average at 10.33 days. Colorado was impacted by another round of hail storms that created capacity issues. States with the most significant dips included Texas (-.83), Washington D.C. (-.77), Florida (-.54) and West Virginia (-.46), although Texas remained above U.S. average at 13.08 days. We predicted in last quarter’s report that Texas would improve in Q2 as it continues to recover from severe hail storms and flooding in Spring of 2016 and anticipate the trend will continue into Q3.
Colorado was impacted by another round of hail storms that created capacity issues.
As with Q1, there was very little consistency between regions and states which suggests that the flat U.S. number is not reflective of a true national trend.
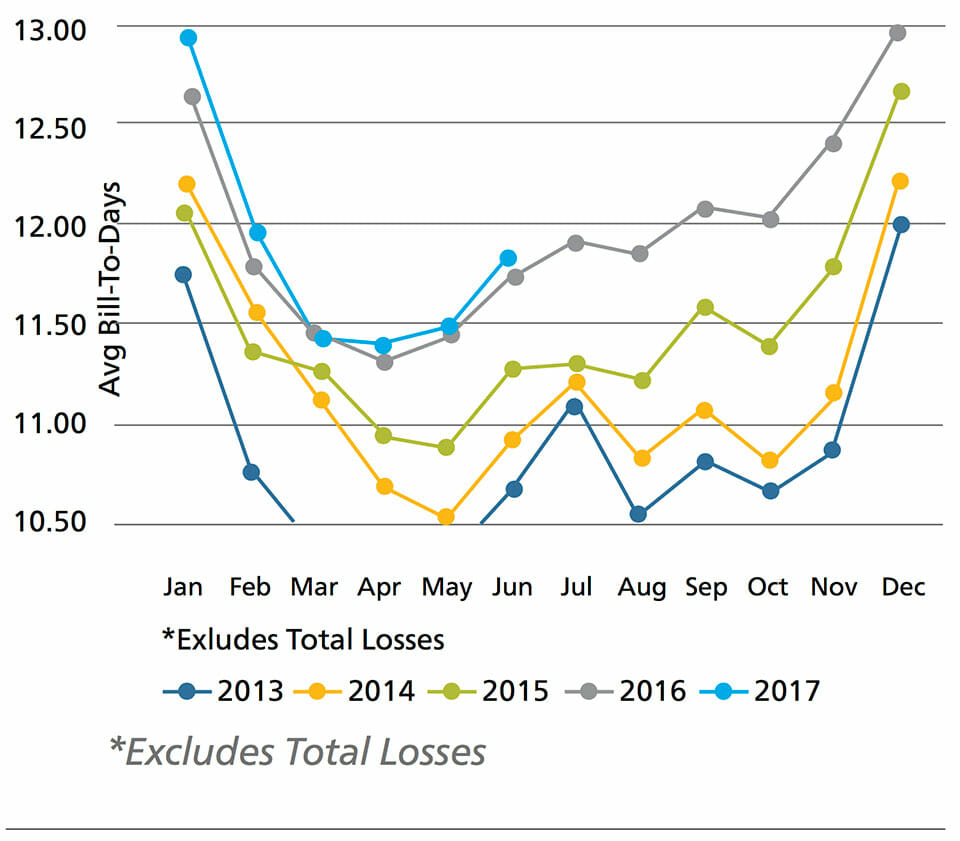
Although growth leveled o throughout the first 6 months of Calendar 2017, largely as a result of short term weather events, we anticipate a continuation of the long term increase reflected in the five-year trend graph. The core factors driving cycle time (miles driven, claim frequency and repair complexity) remain impactful, particularly as the percentage of vehicles with advanced technology increases. As mentioned in previous updates, regardless of how the market is defined, there remains a significant delta between average and best in class. Shops that focus on building a culture of training, proper utilization of the ARMS® Auto Application and consistent execution of a robust scheduling strategy, routinely outperform market averages.
US Industry Avg Length of Rental
Canada
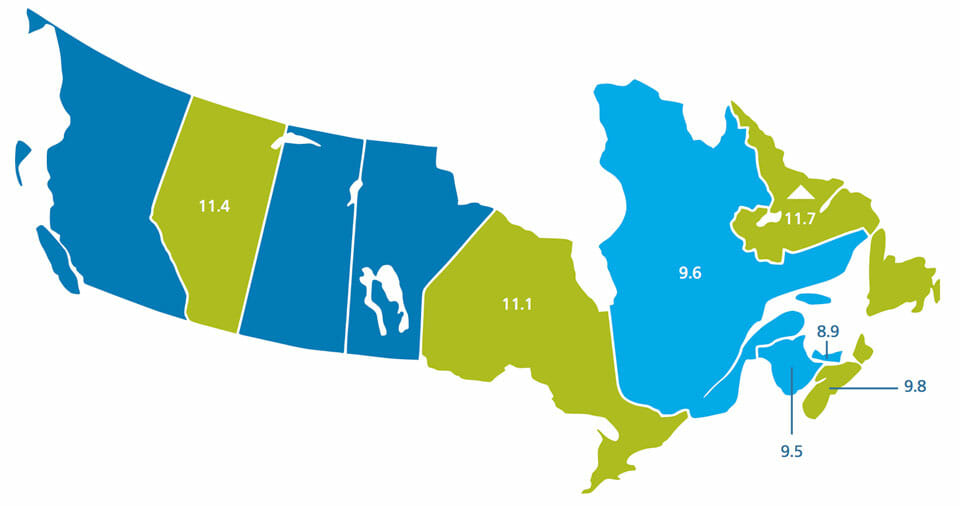
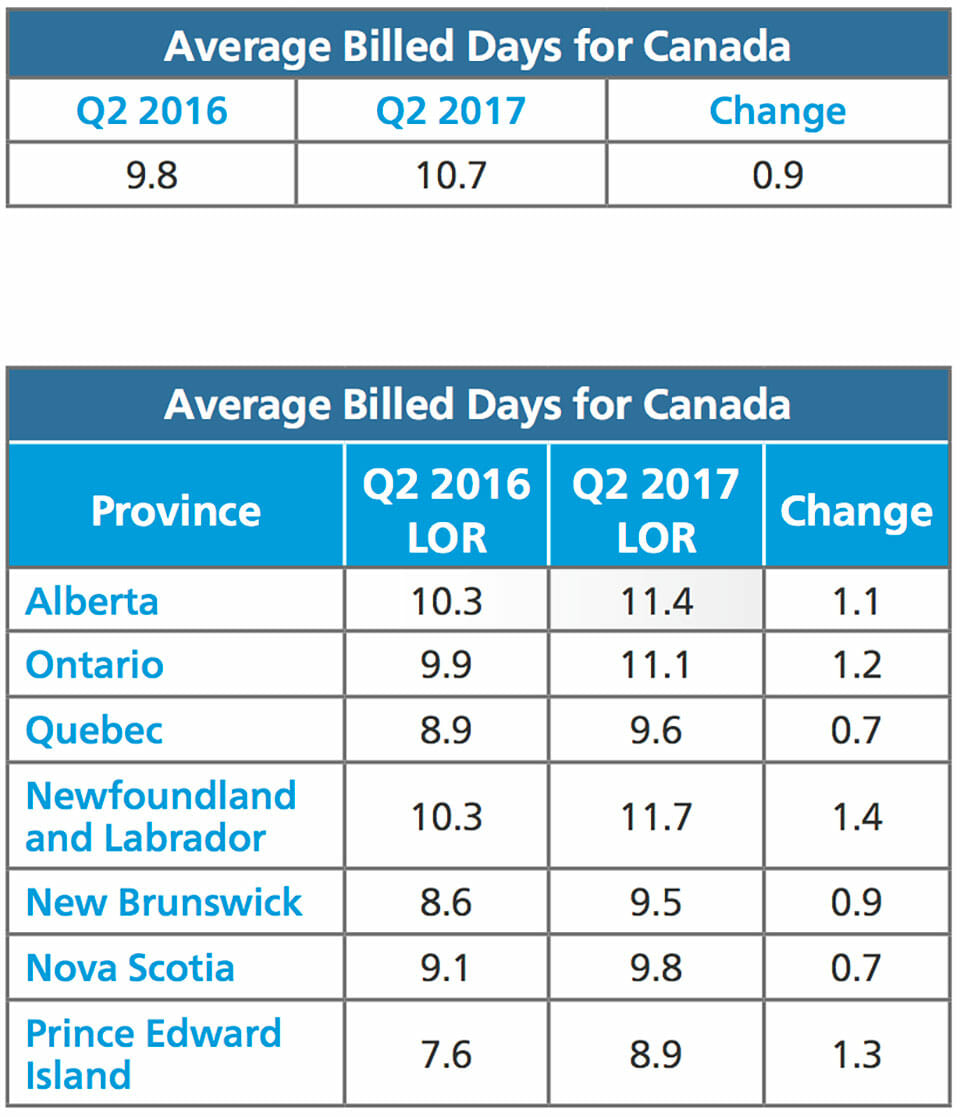
Canada’s Length of Rental (LOR) for Q2 2017 was 10.7 days, a .9 day increase over Q2 2016. For context, this result was .8 days less than the United StatesQ2 result, which finished at 11.5 days. Although the overall U.S. number remains higher than Canada, it is worth noting that the U.S. metric increased only fractionally from Q2 2016 to Q2 2017. Similar to the US, Canada witnessed significant variance in the regional (provincial) results. Unlike Canadian Q1 results, this variance was more applicable to actual LOR results than LOR trends. Every Canadian province saw an increase to its LOR in Q2. In Q1, we saw Newfoundland post a 1 day decrease. Overall LOR ranged from a low of 8.9 days in PEI to a high of 11.7 days in Newfoundland. Provinces that outperformed the national average included PEI, New Brunswick, Quebec and Nova Scotia. From a trend perspective, Quebec, Nova Scotia and New Brunswick each posted increases of less than 1 day. On the other side of the trend line, Ontario, Alberta, PEI and Newfoundland each witnessed a LOR increase of greater than 1 day over Q2 2016. The LOR trend in Canada continues to increase on a quarterly basis. Kilometers driven, claims frequency and complexity of repair remain core drivers of LOR trends. New car sales (and their associated complexity of repair) continue their record setting ways in Canada. Automakers increased their June 2017 sales 6.5% over June 2016. Since the start of 2016, Canadian car sales are up 5%, marking the first time over 1 million cars have been purchased in the first half of the year. (source: Reuters). Collision centers that invest in training, proper use of the ARMS® Auto Application (and its associated reporting features), and robust scheduling strategy routinely outperform LOR market averages.
Shops that focus on building a culture of training, proper utilization of the ARMS® Auto Application and consistent execution of a robust scheduling strategy, routinely outperform market averages.
Canadian Average Length of Rental by Province Q2 2017
![]()
Year-Over-Year Change
Source: Enterprise Rent-A-Car. Includes ARMS® Insurance Company Direct Billed Rentals; Excludes Total Loss Vehicles. The quarterly LOR summary is produced by Dan Friedman, Assistant Vice President Collision Industry Relations and Sales at Enterprise Rent-A-Car. Dan has 21 years of experience with Enterprise working within the collision repair industry. Through its ARMS® Automotive Suite of Products, Enterprise provides collision repair facilities with free cycle time reporting with market comparisons, free text/email capability to update their customers on vehicle repair status, and online reservations. More information is available at armsautosuite.com or by contacting Dan Friedman at Daniel.Friedman@ehi.com.