Average Length of Rental for Repairable Vehicles: Q2 2018
The quarterly LOR summary is produced by Dan Friedman, Assistant Vice President Collision Industry Relations and Sales at Enterprise Rent-A-Car. Dan has 23 years of experience with Enterprise working within the collision repair industry. Through its ARMS® Automotive Suite of Products, Enterprise provides collision repair facilities with free cycle time reporting with market comparisons, free text/email capability to update their customers on vehicle repair status, and online reservations. More information is available at armsautosuite.com or by contacting Dan Friedman at Daniel.Friedman@ehi.com.
U.S. Length of Rental—Q2 2018
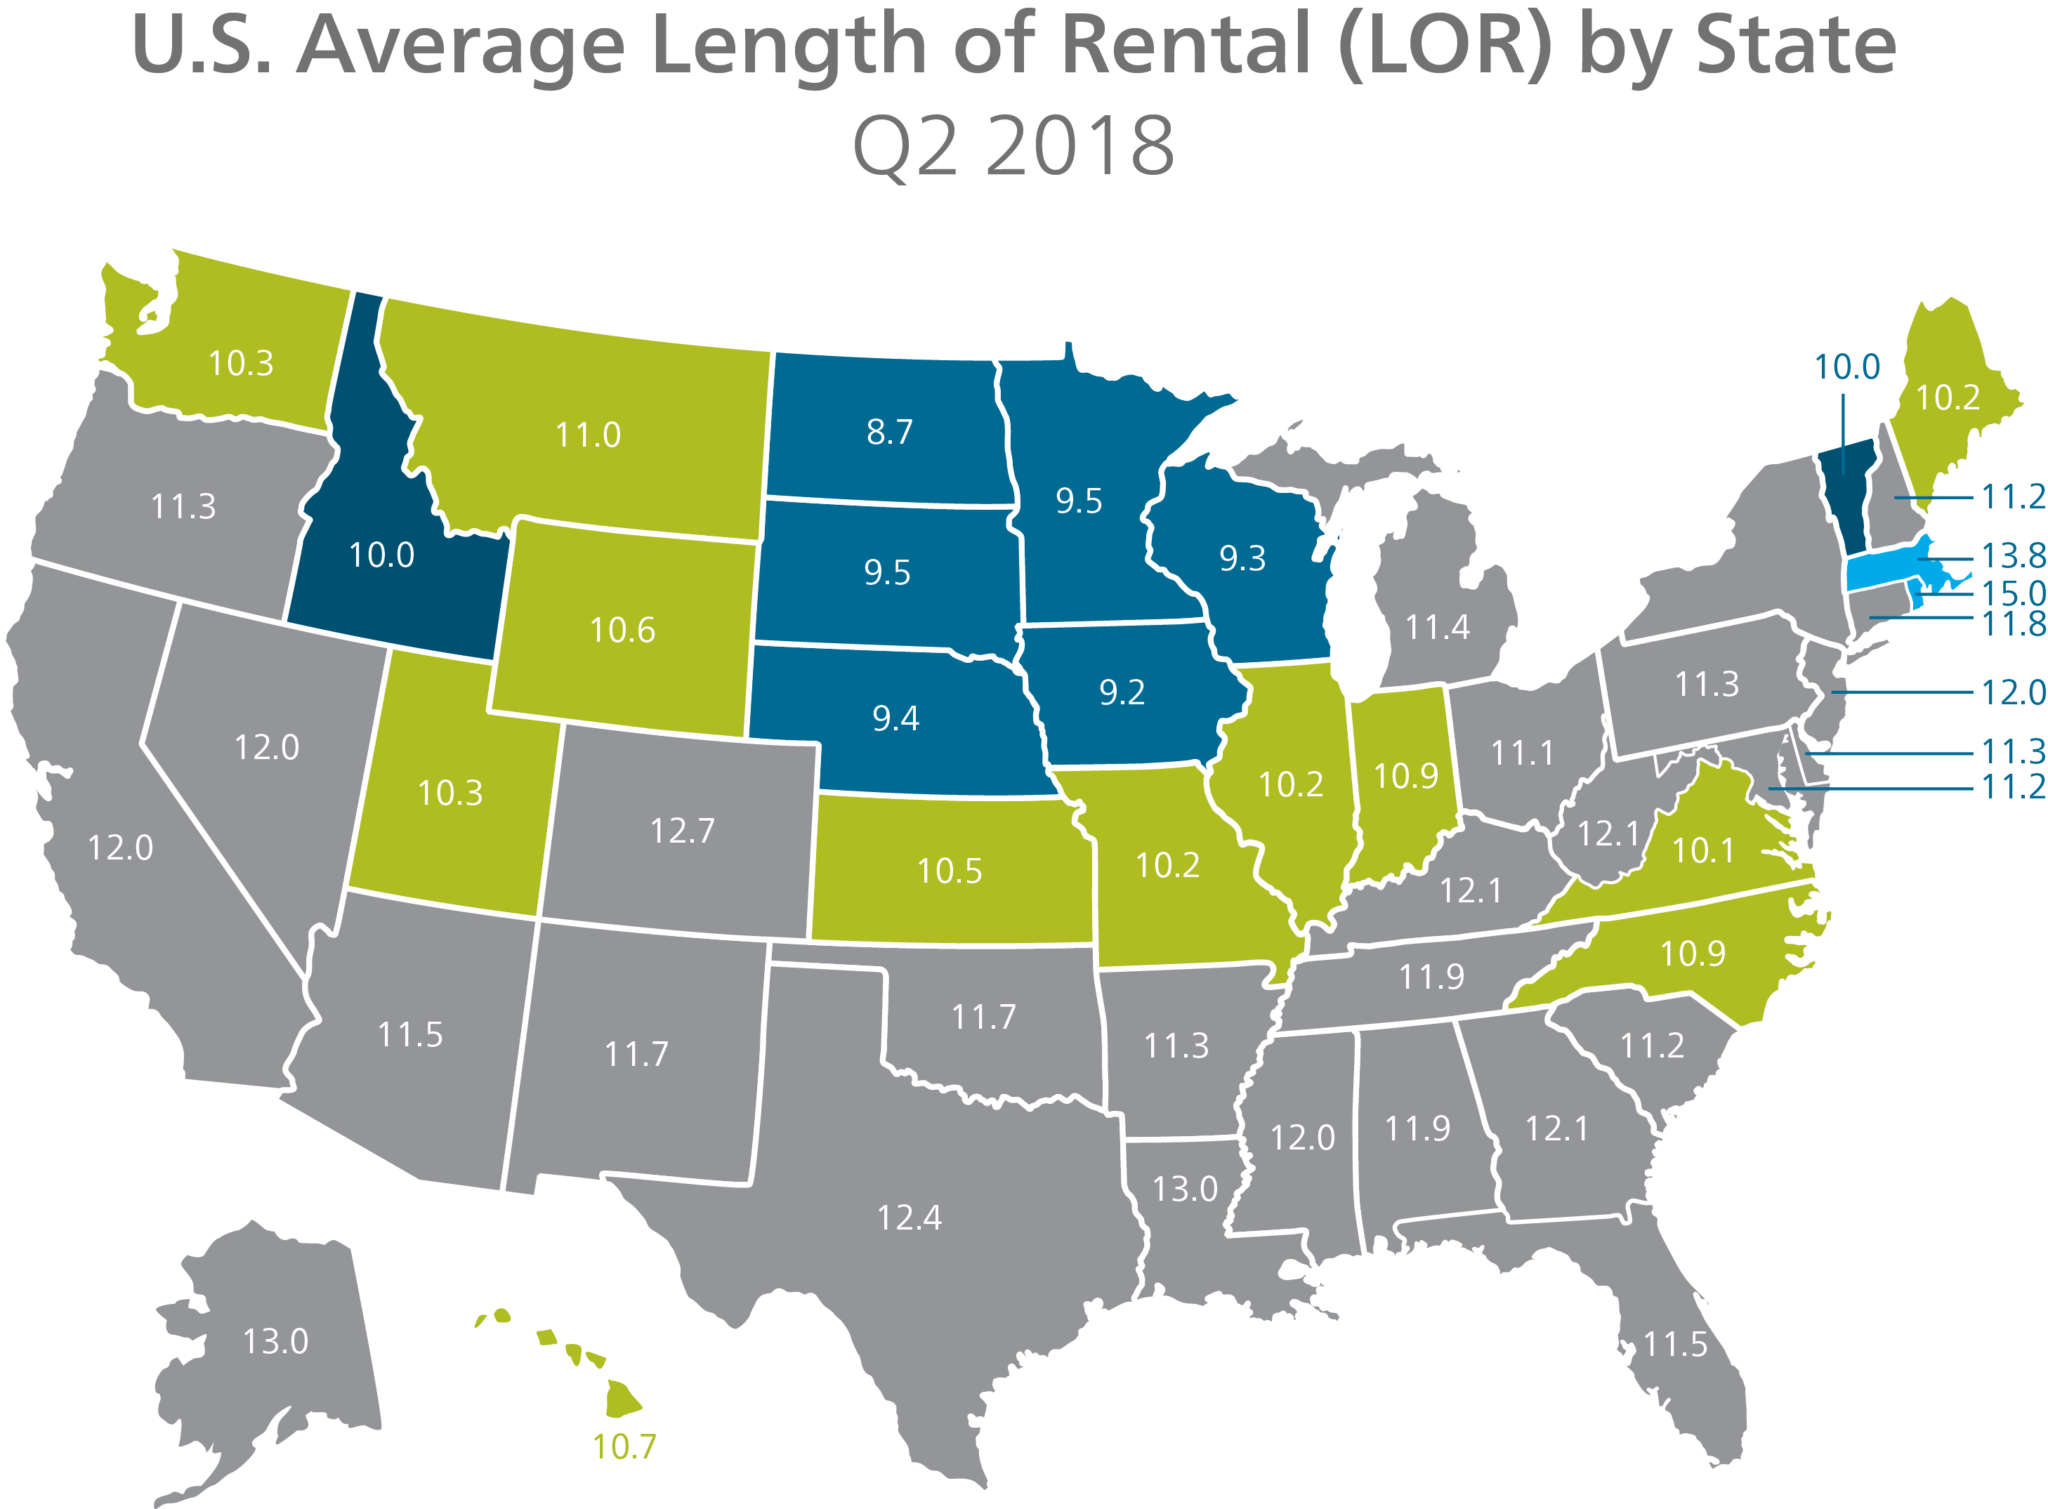
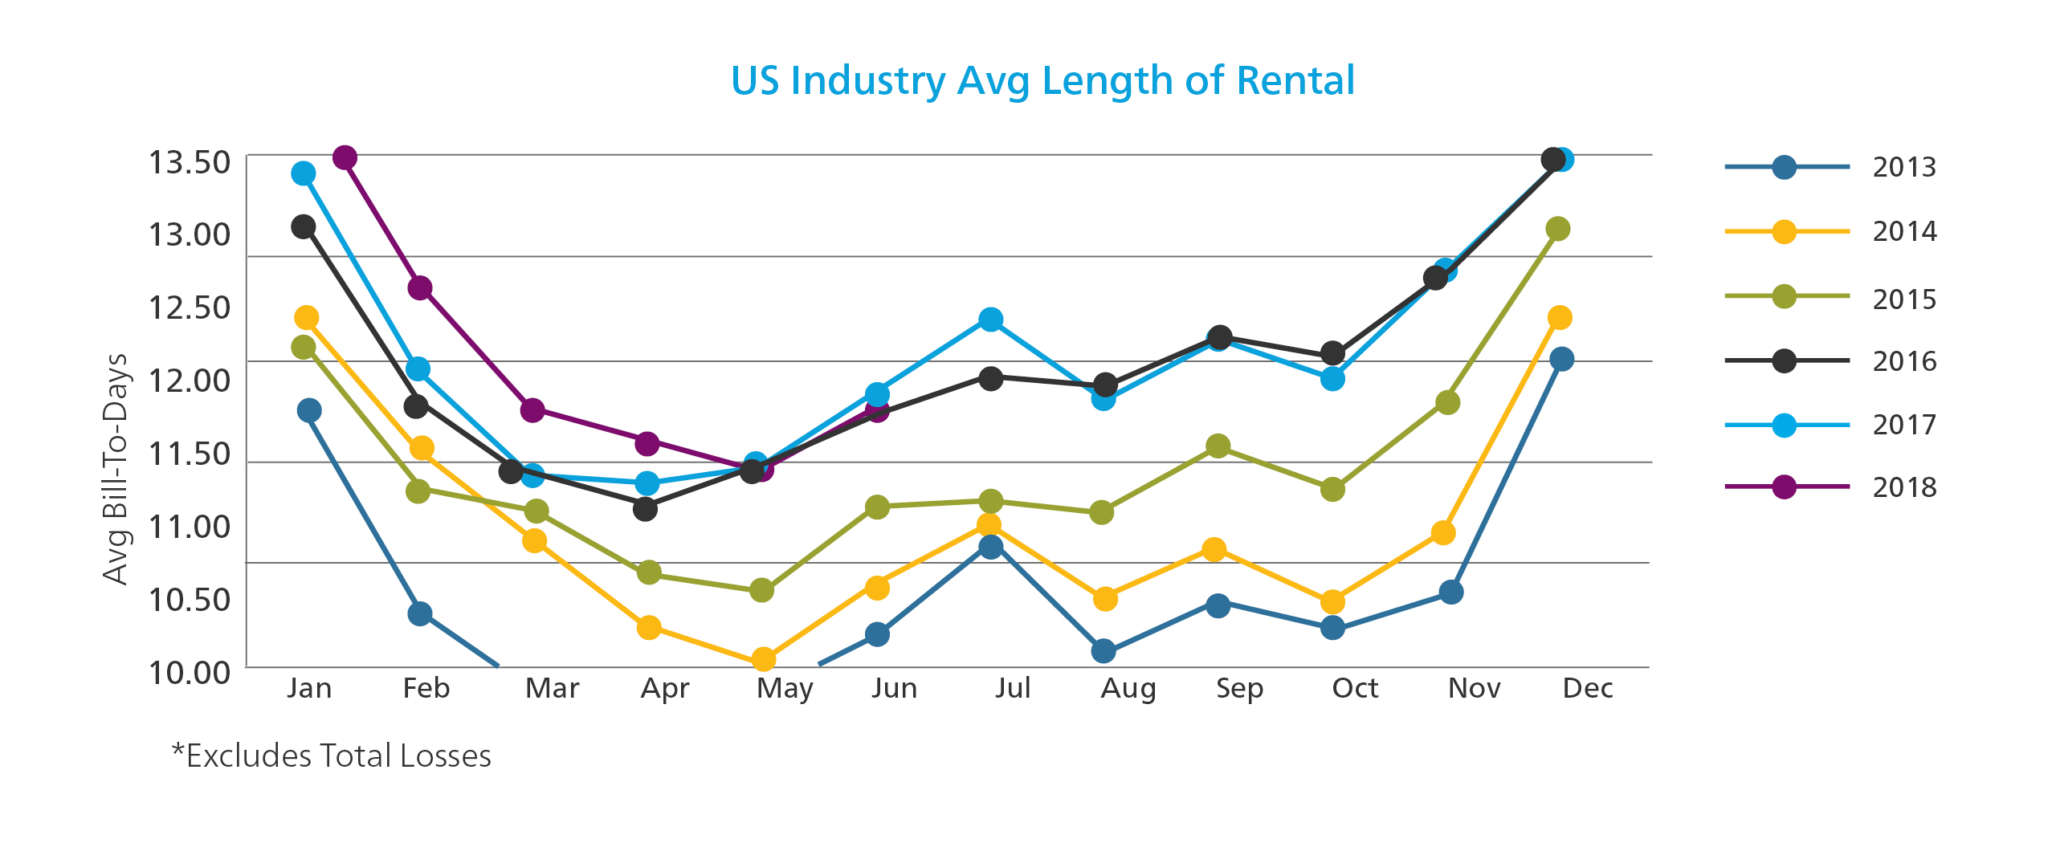
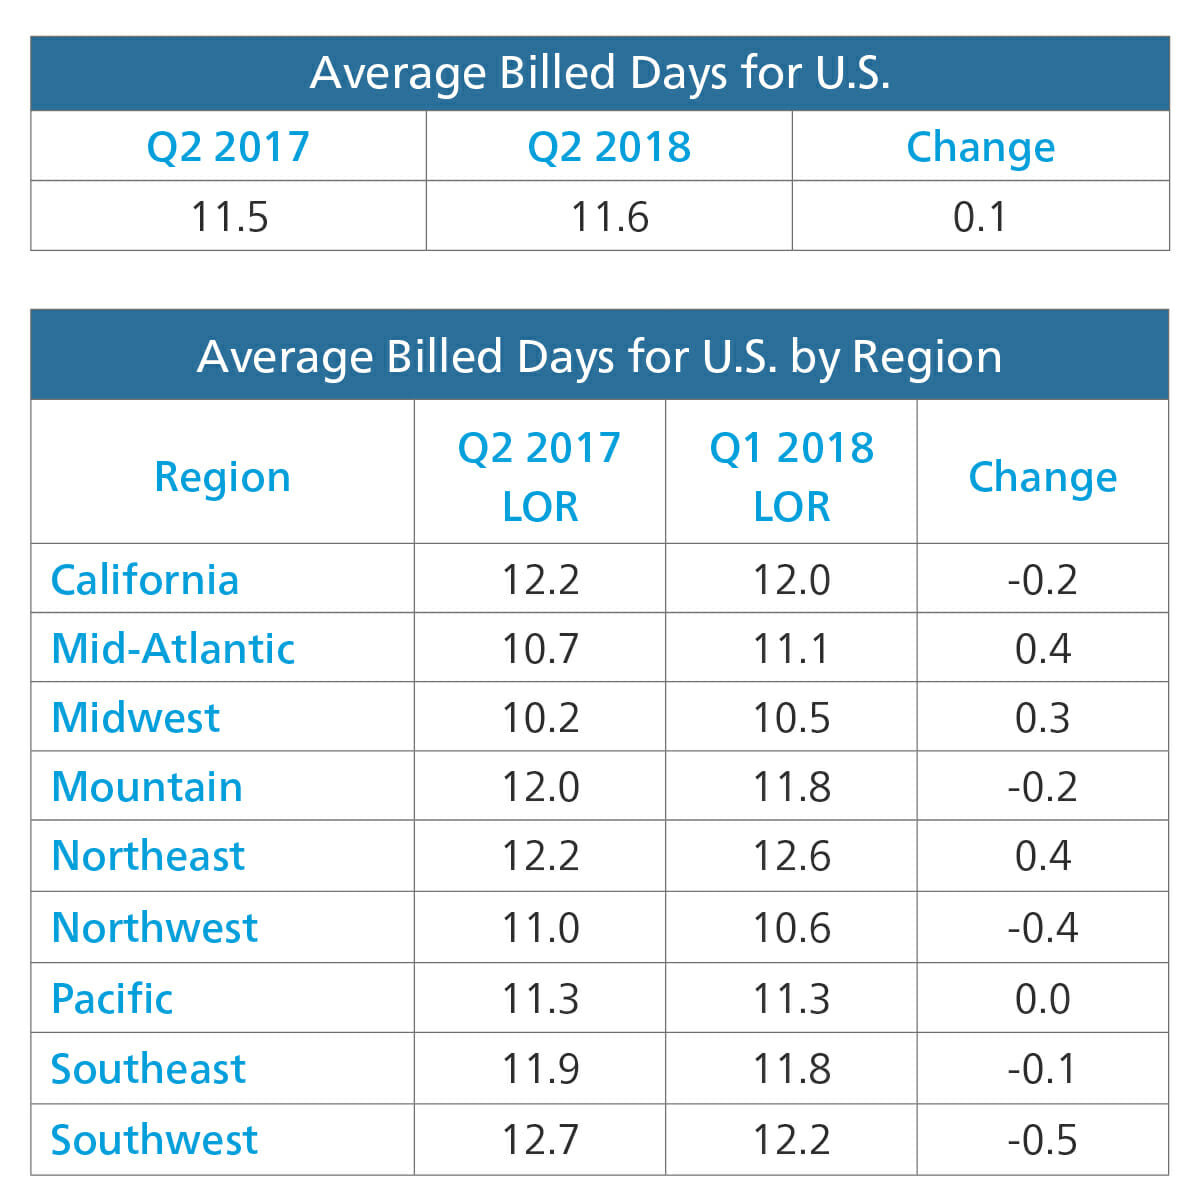
Average Length of Rental (LOR) for Q2 2018 landed at 11.6 days in the United States, an increase of 0.1 days compared to Q2 2017. This stagnation in the 2nd Quarter is now an official trend after similar results in 2017 and 2016. Once again, there was very little consistency between regions and states, suggesting that the quarterly result for the U.S. is not reflective of a genuine national course. The Northeast and Mid-Atlantic regions produced the largest increases at 0.4 days while the Southwest and Northwest had the steepest declines at -0.5 and -0.4 days, respectively. The average LOR ranged from a high of 12.6 days in the Northeast to a low of 10.5 in the Midwest.
At the state level, Puerto Rico and North Dakota were once again the outliers at 17 and 8.7 days, respectively. At least 25 states deviated significantly in terms of year-over-year change, further demonstrating a lack of consistency. Puerto Rico (4.9), South Dakota (1.2), West Virginia (0.9) and Nebraska (0.9) produced the largest increases, with the Island still being impacted by the devastation of Hurricane Maria. The most significant decreases in LOR included Wyoming (-1.2), Oregon (-1.1), South Carolina (-0.9), Alaska (-0.9) and Texas (-0.7). Alaska (13) remained 1.4 days above the U.S. average (11.6) despite the significant drop.
The average LOR ranged from a high of 12.6 days in the Northeast to a low of 10.5 in the Midwest.
As pointed out in previous updates, there remains a significant delta between average and best in class. Collision centers that invest in extensive training, consistently execute a robust scheduling strategy, and properly utilize the ARMS® Auto application, routinely outperform market-average LOR metrics.
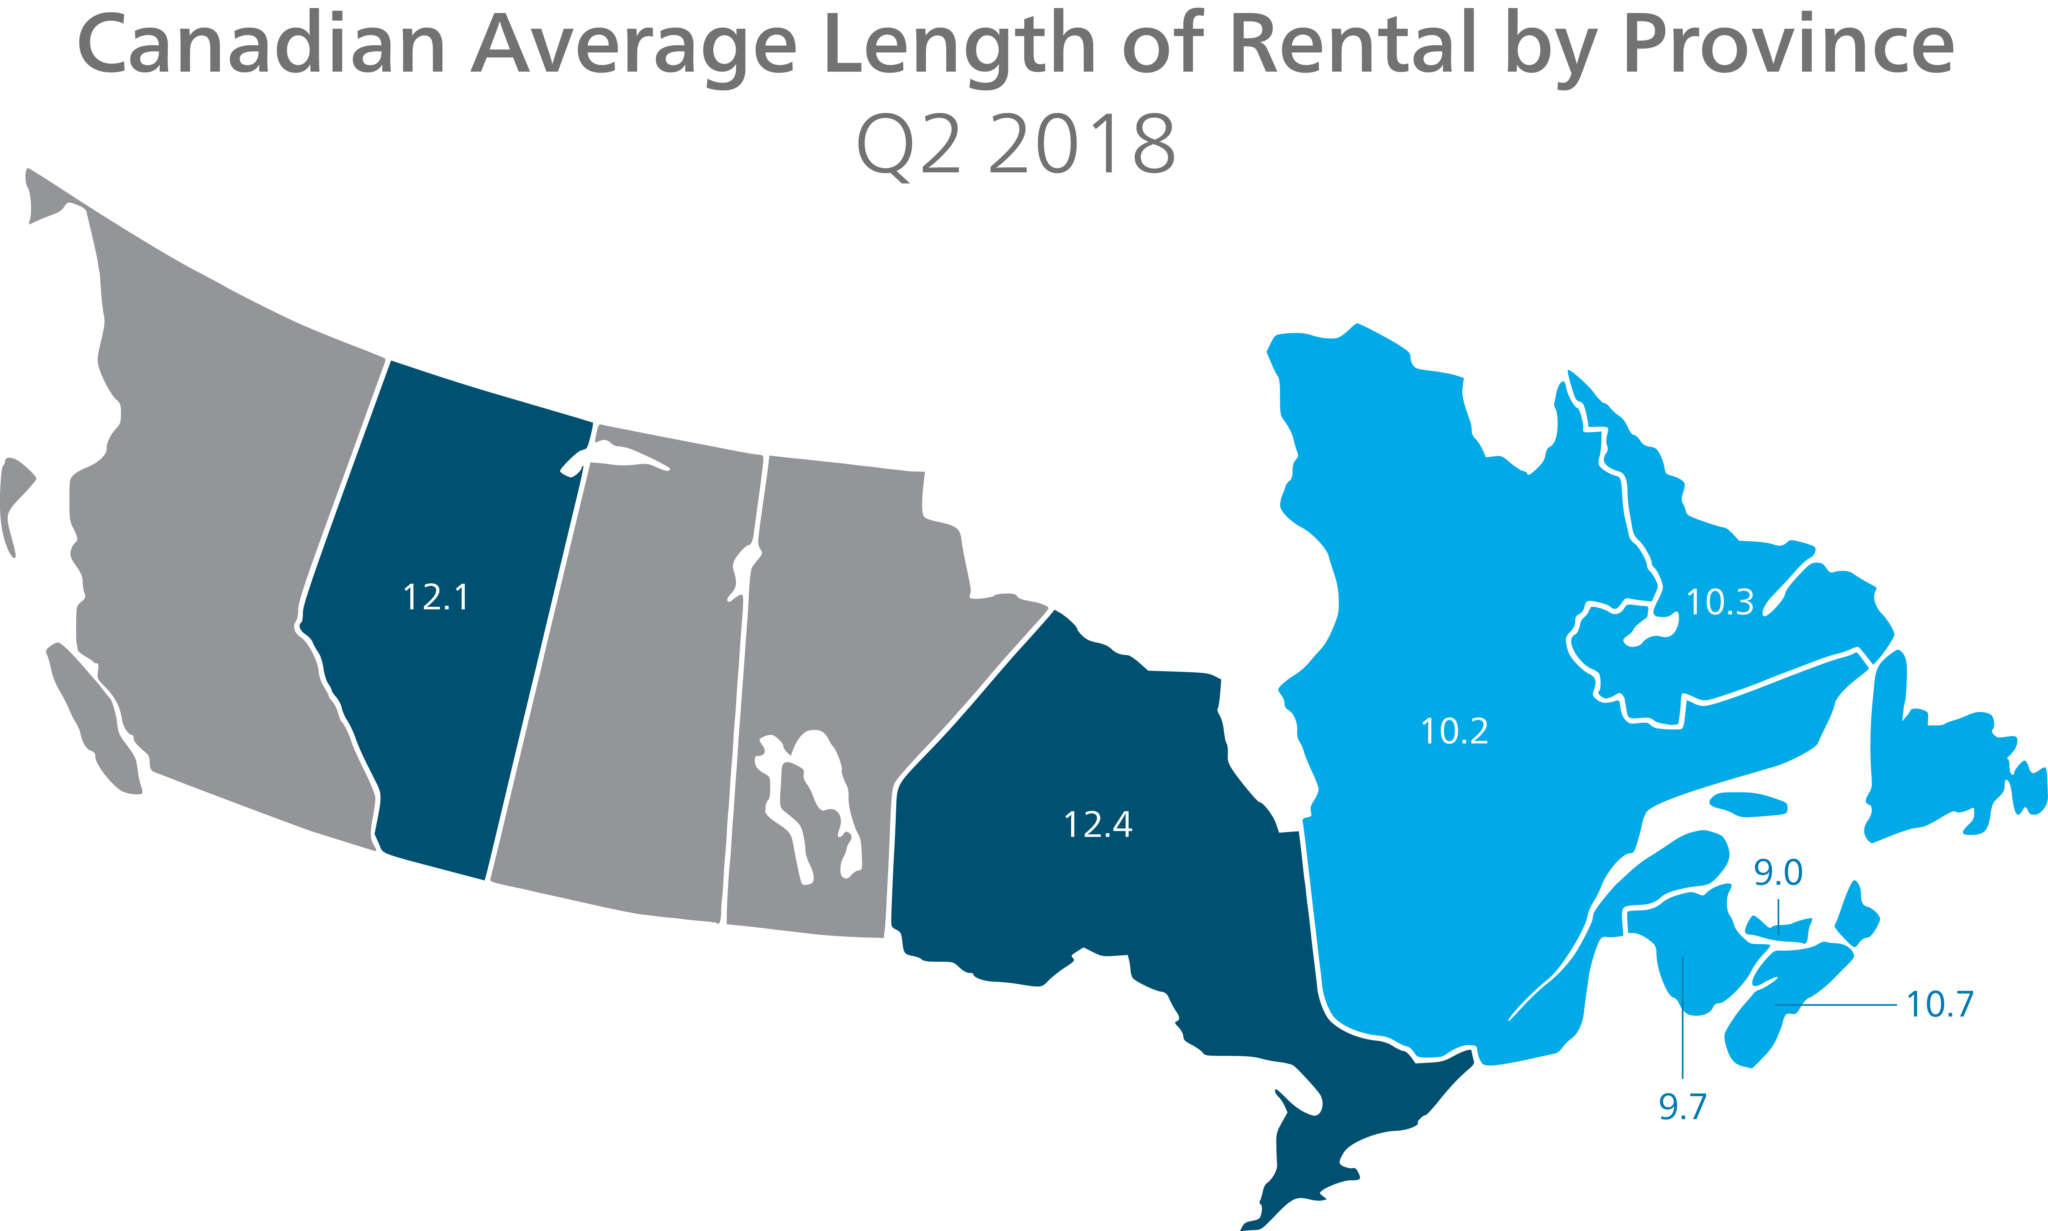
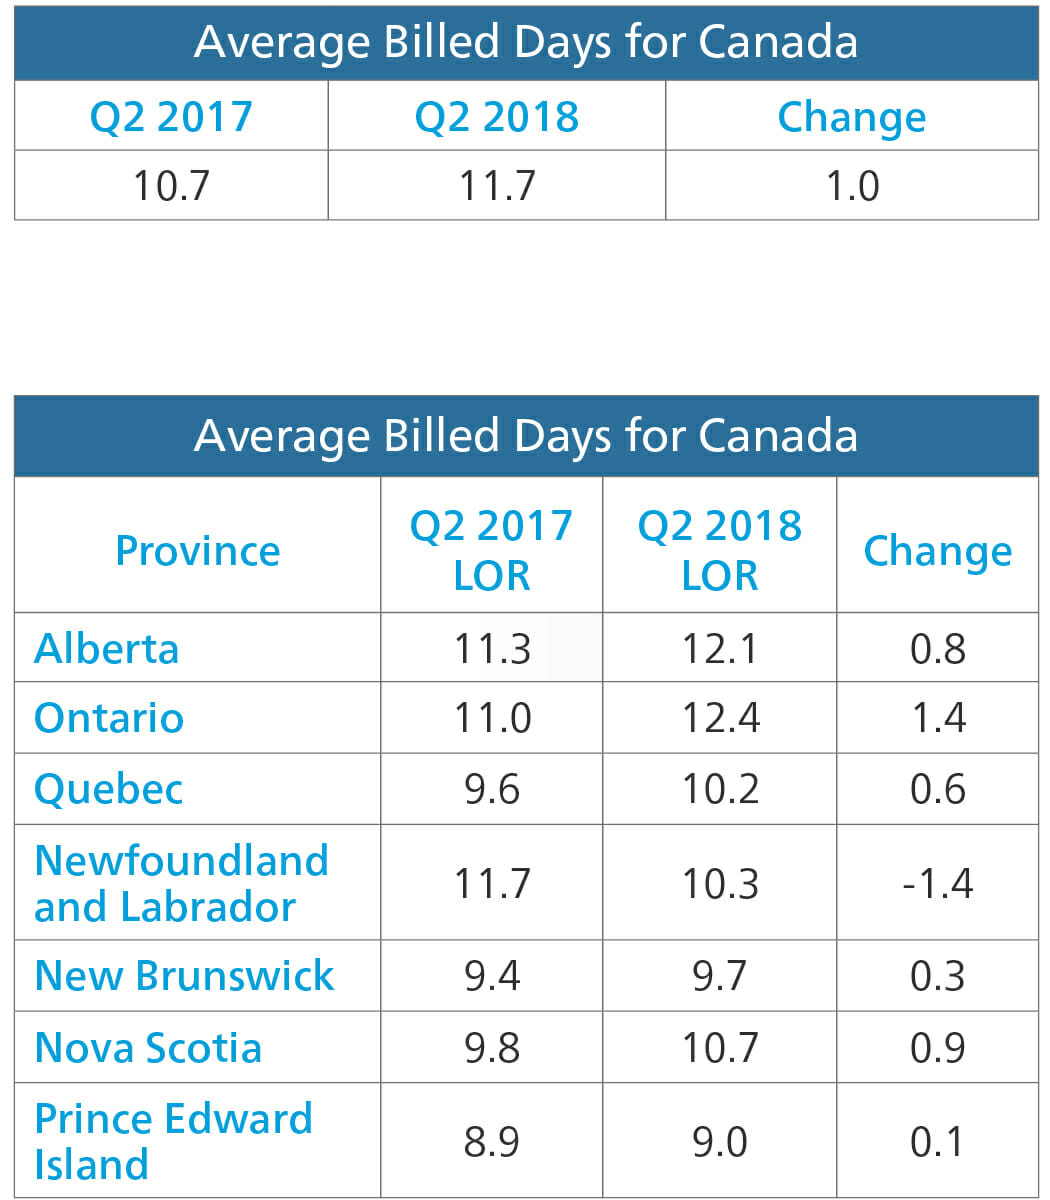
Canada Length of Rental—Q2 2018
Canada’s Length of Rental (LOR) was 11.7 days for Q2 2018. This result fell exactly in the middle of the two comparison periods. It was an entire day shorter than the 90-day period immediately preceding it (Q1 2018) where LOR was 12.7 days. In addition, it was an entire day longer than the same time period last year (Q2 2017) where LOR was 10.7 days. With the United States witnessing a nominal LOR increase of 0.1 days over Q2 2017 to 11.6 days, the two countries were in near lockstep for Q2 2018, with just 0.1 days separating them. Consistent with past results, we saw a large variance when we compared Canada’s provincial results for Q2 2018. Newfoundland was the only province that produced an LOR decrease (and it was a significant reduction of 1.4 days) over Q2 2017. Meanwhile, six provinces posted an increase over last year, ranging from 0.1 to 1.4 days. While Ontario was the sole province to add over 1 day to its LOR (1.4 days), Nova Scotia and Alberta were not far behind at 0.9 days and 0.8 days, respectively. Overall, Canada’s Q2 2018 LOR ranged from a low of 9 days in Prince Edward Island to a high of 12.4 days in Ontario. Provinces that posted LOR results below (better) than the national average included Quebec, Newfoundland, New Brunswick, Nova Scotia and PEI.
Overall, Canada’s Q2 2018 LOR ranged from a low of 9 days in Prince Edward Island to a high of 12.4 days in Ontario.
As in the US, there is a significant difference between “Average” and “Best in Class” results for Canada. Collision Centres that invest in an effective scheduling strategy, extensive employee training and proper utilization of the ARMS® Auto suite of products should expect to outperform the market average.