

Average Length of Rental for Repairable Vehicles: Q3 2016
Continuing a recent trend, U.S. Length of Rental (LOR) increased by .5 days in the third quarter versus the same period the previous year (11.4 to 11.9) powered by a surge in claims frequency and an escalation of complex repairs. The regional results are very similar to those from the second quarter with the Southwest nearly two days longer than the U.S. average at 13.8 days, an increase of 1.3. While the Northeast generated the second longest LOR, it was flat versus 2016, the only region to avoid a jump. The California, Mountain and the Northwest regions each posted significant increases as well. Nearly every state in the Southwest increased. However Texas was the primary driver of the region’s performance after surging by 1.6 days as it continues to deal with the impact of this spring’s devastating hail storms. Arizona also experienced a significant jump of .8 days while Oklahoma was flat, and the only state in the region to not experience an increase. Every state on the West Coast experienced an increase with California and Oregon at .8 days. The Mountain region exceeded the U.S. average with a .7 day increase generated by relatively consistent moves across each of the states. Montana was the lone outlier with an increase of one day. The other two western states, Alaska and Hawaii were essentially flat.
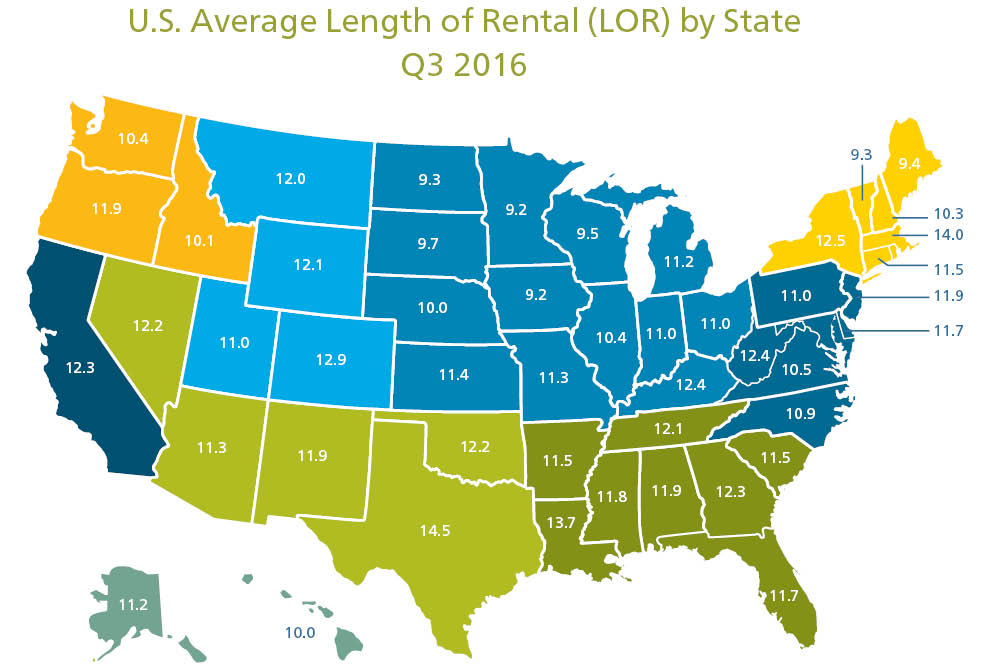
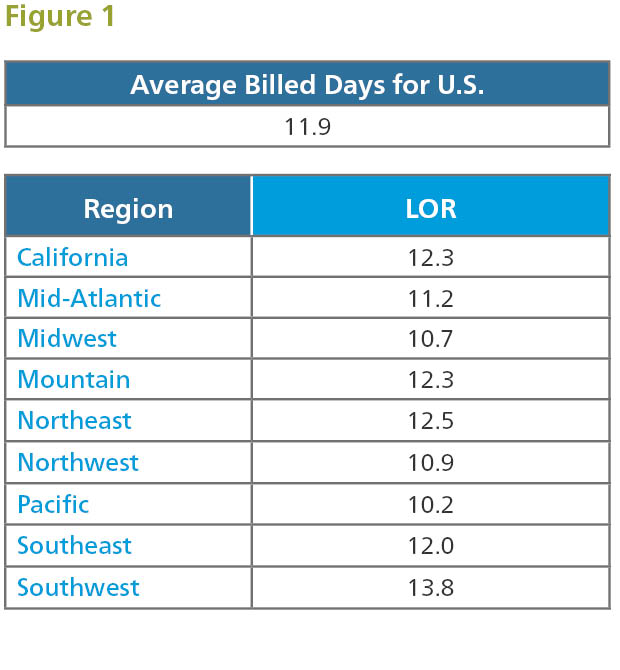
Every state on the West Coast experienced an increase with California and Oregon at .8 days. The Mountain region exceeded the U.S. average with a .7 day increase generated by relatively consistent moves across each of the states. The Midwest and Mid-Atlantic regions produced increases of .4 days each with most states close to the average, however there were a few outliers. Kansas and Missouri jumped by 1.1 and .8 days, respectively, while South Dakota was the lone state to decline, falling .2 days. The Northeast stayed flat making it the only region not to increase. While some of the states experienced modest climbs, Connecticut, Maine, Massachusetts, New Hampshire and Vermont each generated slight improvements.
Canada
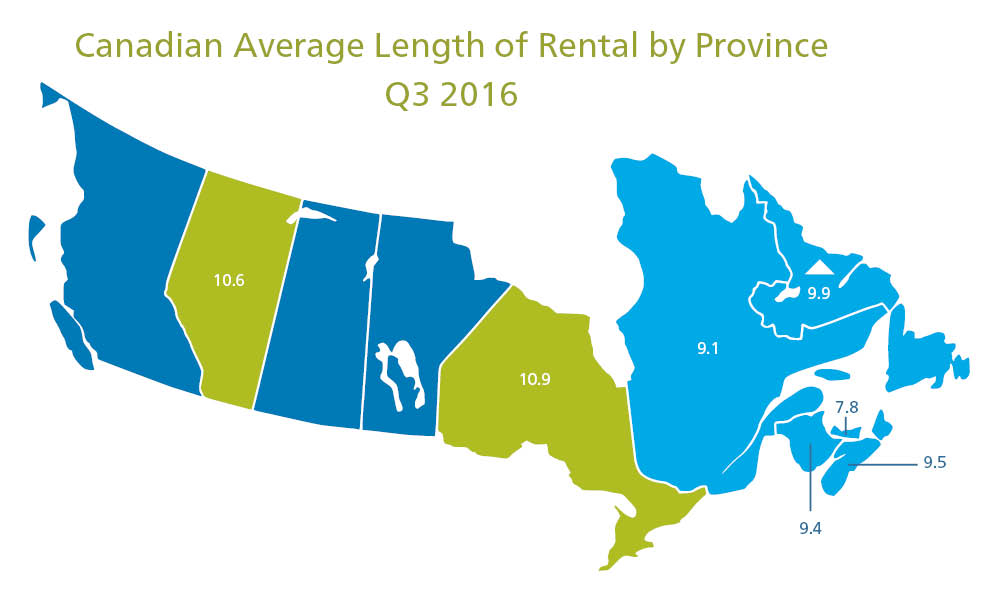
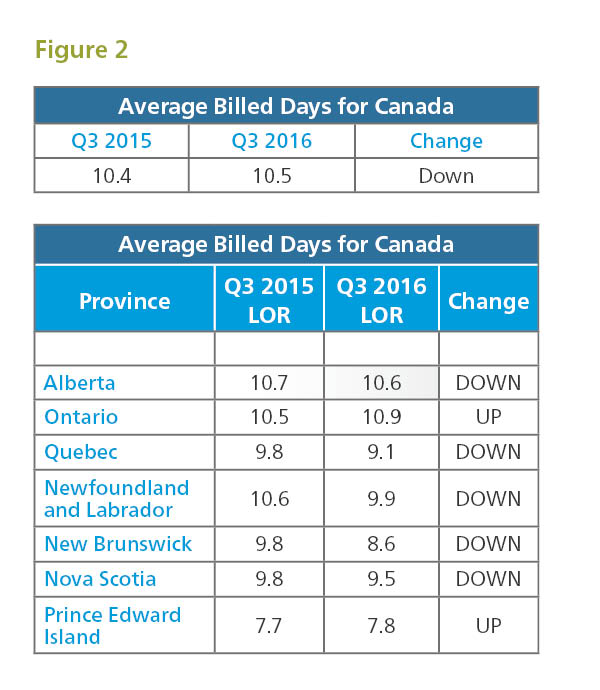
Witnessing a similar trend of the U.S., Canadian Length of Rental (LOR) increased .1 days to 10.5 in 2016 versus 2015 for the quarter ending Sept. 30 (Q3). It is worth noting that despite this result vis-à-vis the U.S., Canadian LOR was more than a full day lower than the U.S. (10.5 days in Canada vs. 11.9 days in the U.S.). Provincial differences were significant, with Prince Edward Island delivering the best and lowest result at 7.8 days, while Ontario saw the highest LOR at 10.9 days. Alberta continues to see its LOR results improve (decrease), posting a .1 day improvement to 10.6 days. Ontario, meanwhile, saw a 0.4 increase in its LOR over the same quarter in 2015 to 10.9 days. Quebec tied Newfoundland for the best improvement in Canada, shaving 0.7 days over the 2015 Q3 result and moving to 9.1 days. In each state and region, there is a significant delta between the top and bottom quartiles which indicates the opportunity for shops to drive results by focusing on the elements they are able to control. The three most impactful pieces, based on data and feedback from best in class operations, are formal training (I-Car Gold shops outperform the market by approximately 1.3 days), utilization of the ARMS Data Manager (approximately 1 day better) and a robust scheduling strategy. Excluding PEI, the remaining Atlantic provinces posted results within 1.1 days of the Canadian average. Interestingly, all Atlantic provinces still managed to outperform the Canadian average, and with the exclusion of PEI, all Atlantic provinces showed LOR improvement (reduction) over 2015. After PEI, New Brunswick led Atlantic Canada with a 9.4 day LOR (down .1 day from 2015), followed by Nova Scotia at 9.5 days (down .3 days from 2015), and then Newfoundland at 9.9 days (down from .7 days from 2015). British Columbia, Saskatchewan and Manitoba are excluded due to the presence of government insurers ICBC, MPI and SGI. Similar to the U.S., there is a connection between the use of the ARMS® Data Manager and lower LOR results at the body shop level.
Year-Over-Year Change
Source: Enterprise Rent-A-Car. Includes ARMS® Insurance Company Direct Billed Rentals; Excludes Total Loss Vehicles. The quarterly LOR summary is produced by Dan Friedman, Assistant Vice President Collision Industry Relations and Sales at Enterprise Rent-A-Car. Dan has 21 years of experience with Enterprise working within the collision repair industry. Through its ARMS® Automotive Suite of Products, Enterprise provides collision repair facilities with free cycle time reporting with market comparisons, free text/email capability to update their customers on vehicle repair status, and online reservations. More information is available at armsautosuite.com or by contacting Dan Friedman at Daniel.Friedman@ehi.com.