Canada Segment
At the request of our clients and friends in Canada, we are pleased to provide the following Canada-specific statistics, observations, and trends. All dollar-figures appearing in this section are in CDN$. This data is the product of upload activity from body shops, independent appraisers, and insurance personnel, more accurately depicting insurance-paid loss activity, rather than consumer direct or retail market pricing.
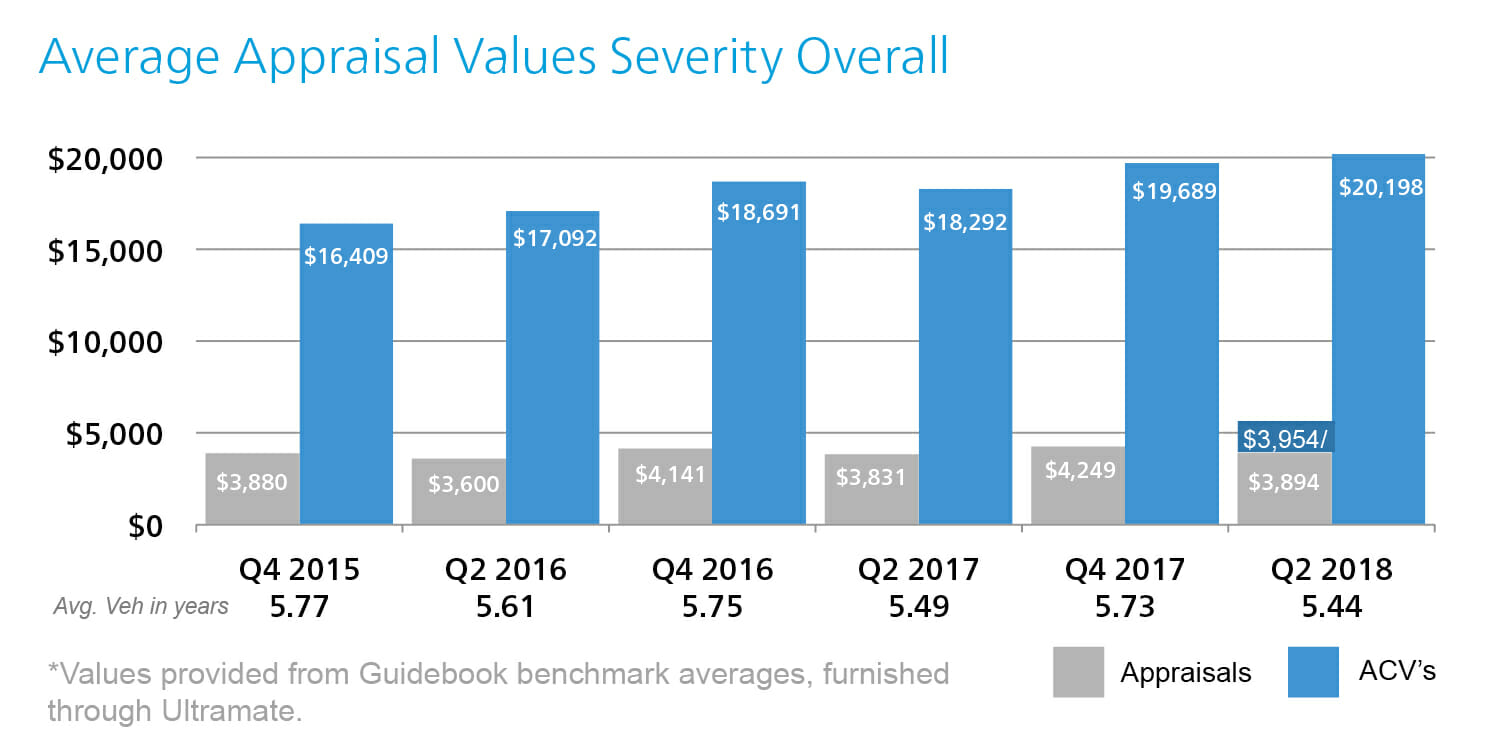
Canadian Appraisal Severity
The average gross initial appraisal value, calculated by combining data from all first and third party repairable vehicle appraisals uploaded through Mitchell Canadian systems in Q2 2018, was $3,894—a $63 increase from Q2 2017. Factoring for development yields an anticipated increase to $3,954.
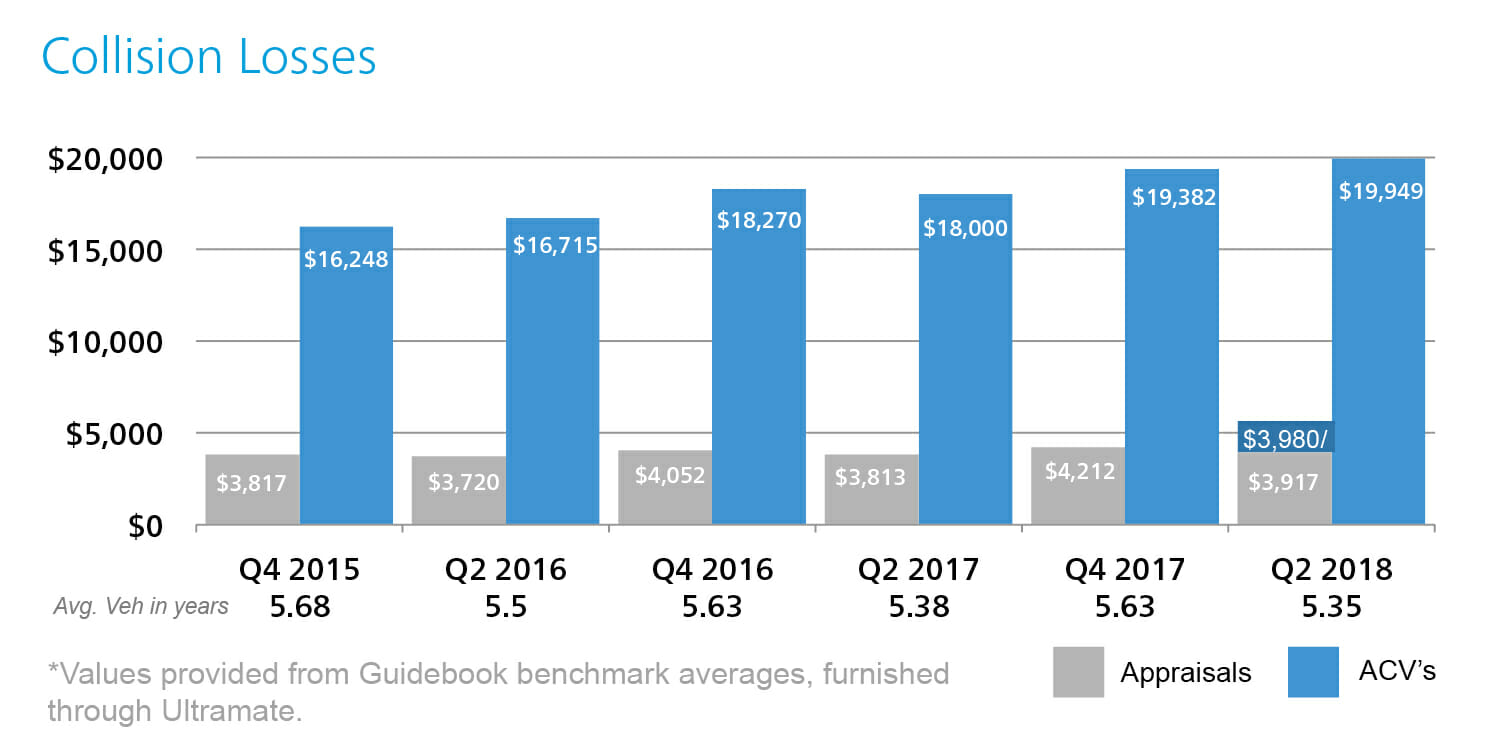
Collision Losses
The average initial gross collision appraisal value uploaded through Mitchell Canadian systems in Q2 2018 was $3,917, a $104 increase from Q2 2017. Factoring for development yields an anticipated increase to $3,980, which represents a $167 increase from Q2 2017.
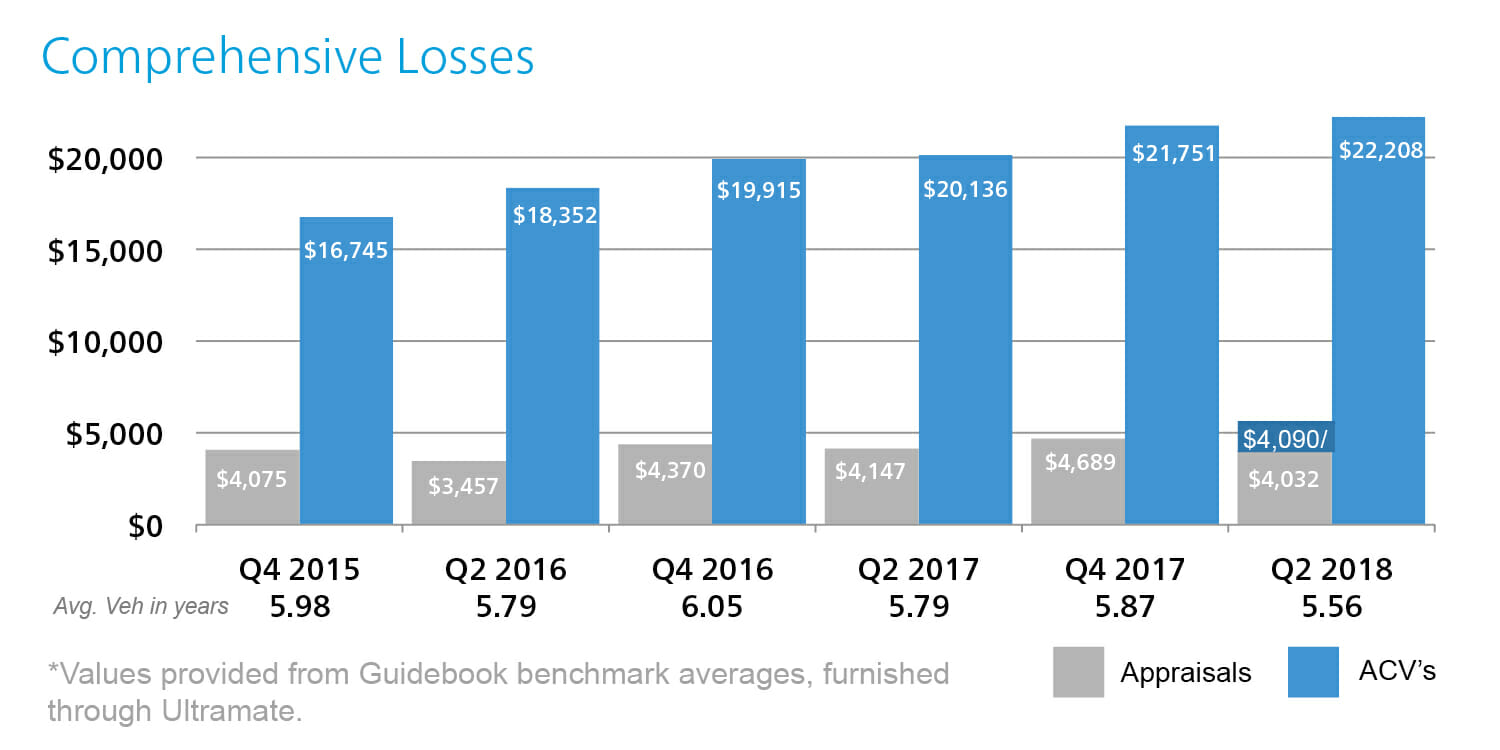
Comprehensive Losses
In Q2 2018, the average initial gross Canadian appraisal value for comprehensive coverage estimates processed through our servers was $4,032, which represents a decrease of $115 compared to Q2 2017. Factoring for development, the anticipated final average appraisal value will be $4,090.
Third-Party Property Damage
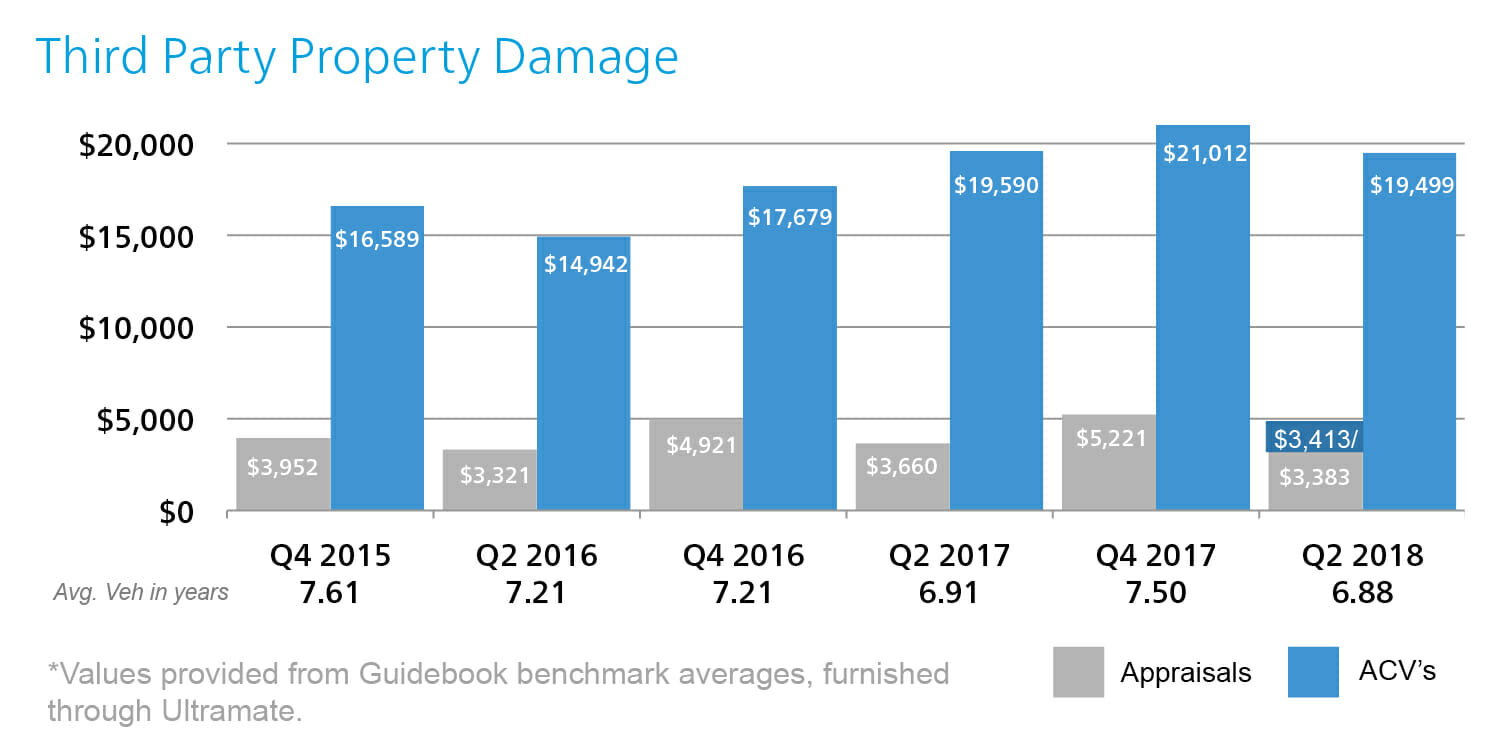
In Q2 2018, our Canadian industry initial average gross third-party property damage appraisal was $3,383, which represents a decrease of $277 from Q2 2017. Factoring for development, we anticipate a final value of $3,413.
Supplements
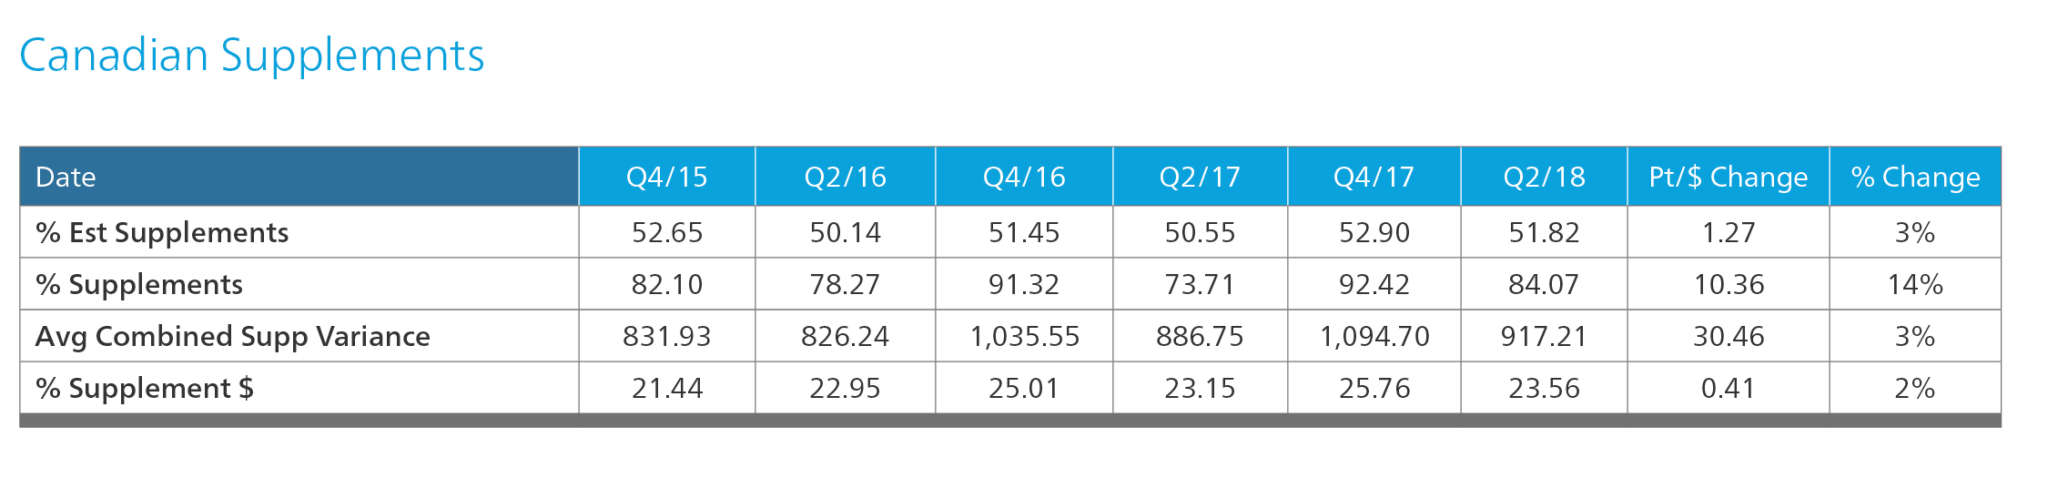
In Q2 2018, 51.82% of all original estimates prepared by Mitchell-equipped Canadian estimators were supplemented one or more times. In this same period, the pure supplement frequency (supplements to estimates) was 84.07%. The average combined supplement variance for this quarter was $917.21, $30.46 higher compared to Q2 2017.
Adjustments
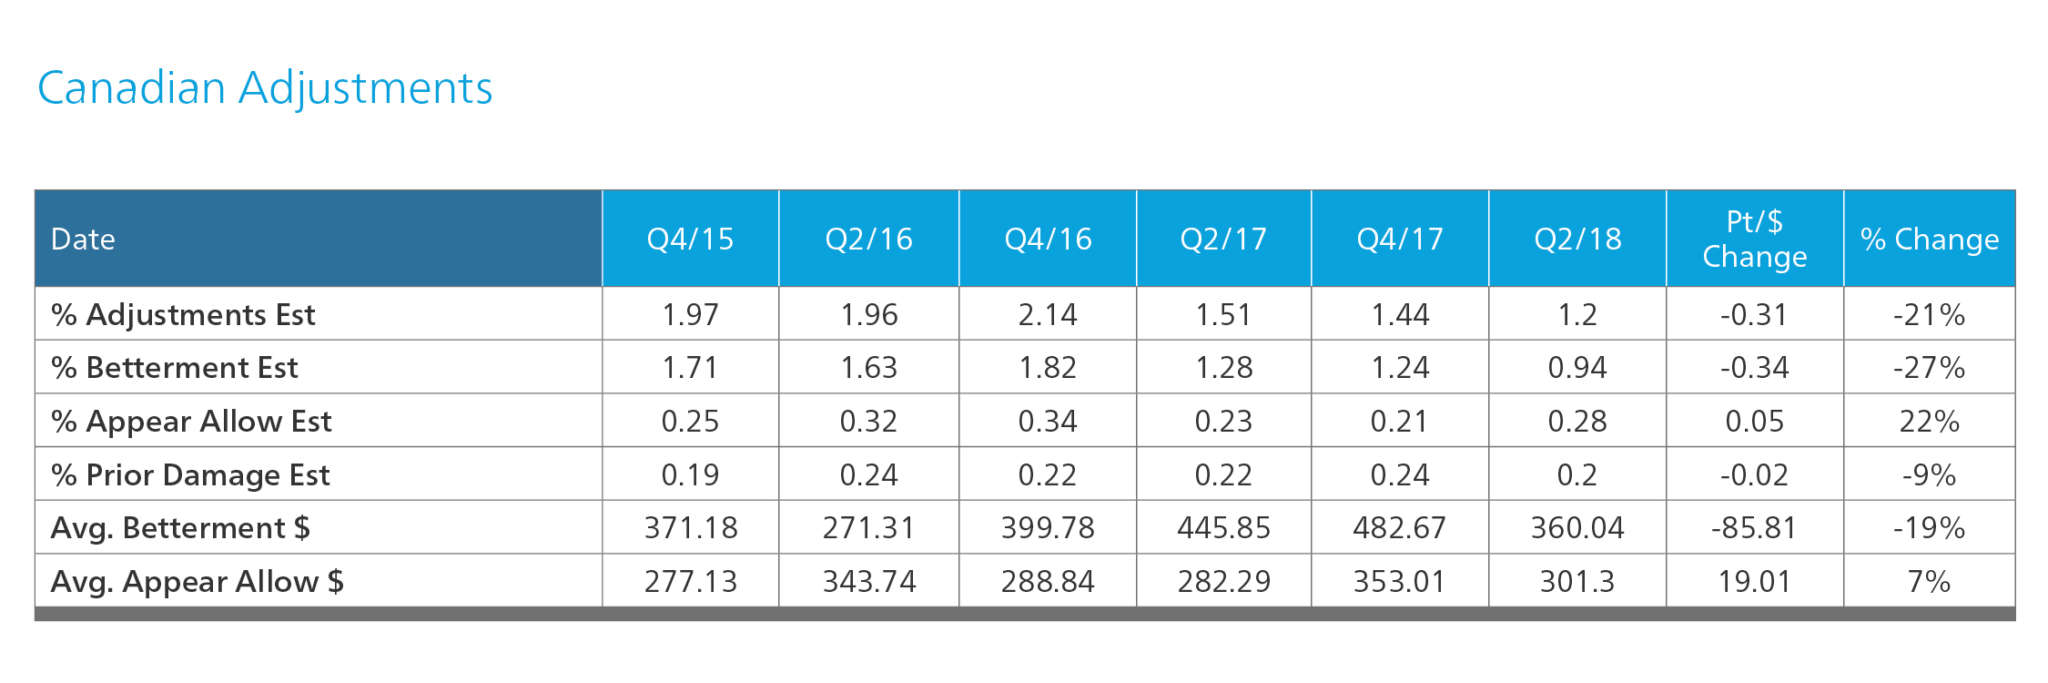
In Q2 2018, the average frequency of betterment taken on estimates decreased by 21%, while the dollar amount of that betterment decreased by 19%. Appearance allowance frequency increased slightly, while the average dollar amount of those allowances increased by 7% to $301.30 when compared to Q2 2017.
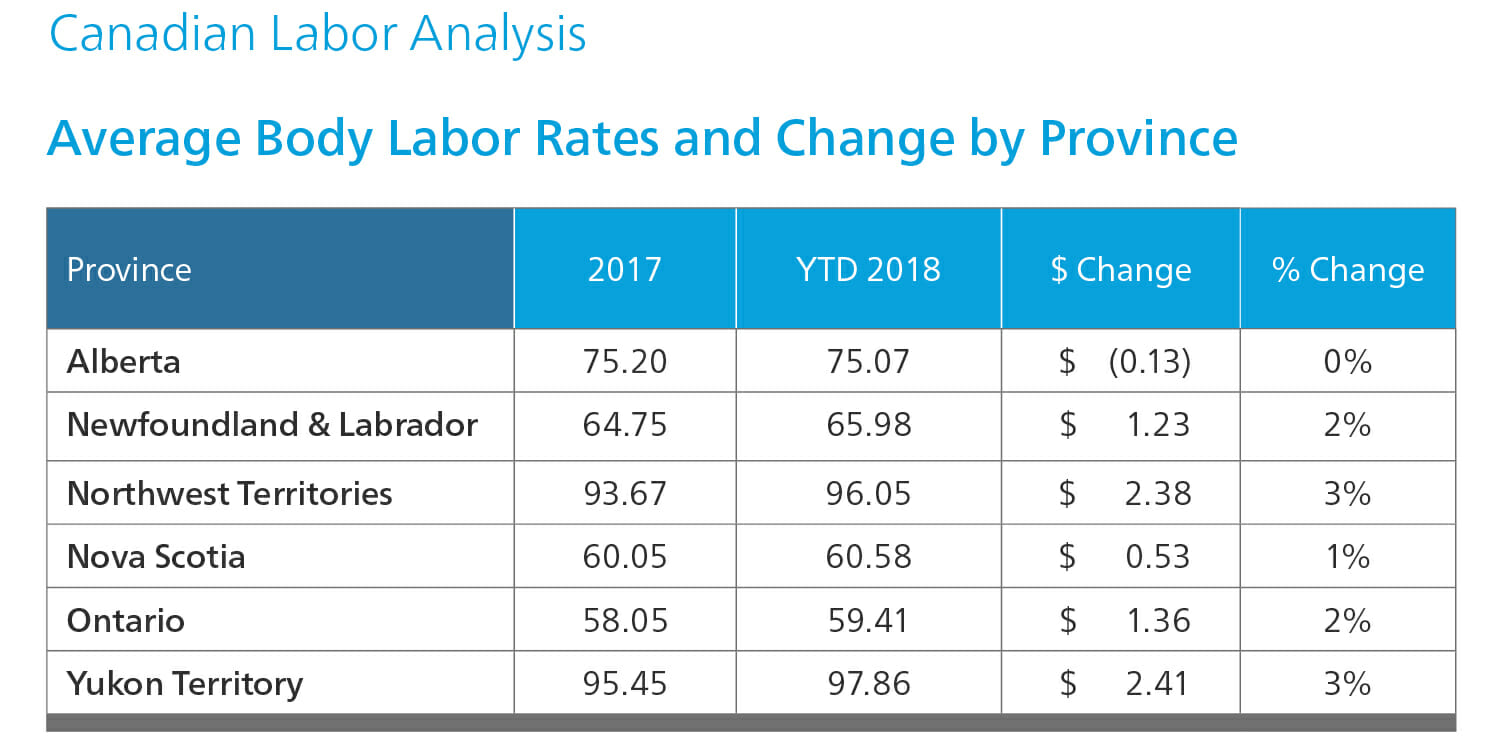
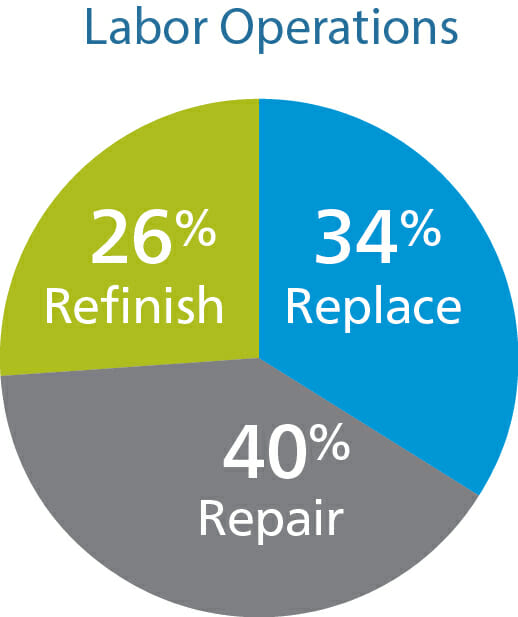
This data reflects the percentage of labor dollars utilized in the creation of Mitchell appraisals by Canadian estimators.
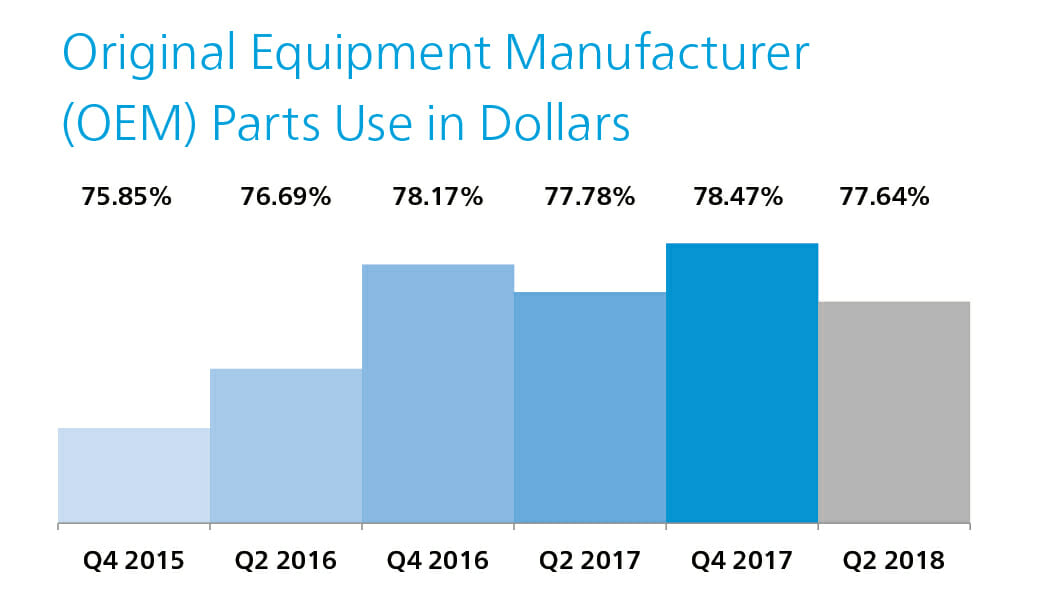
Canada Parts Utilization
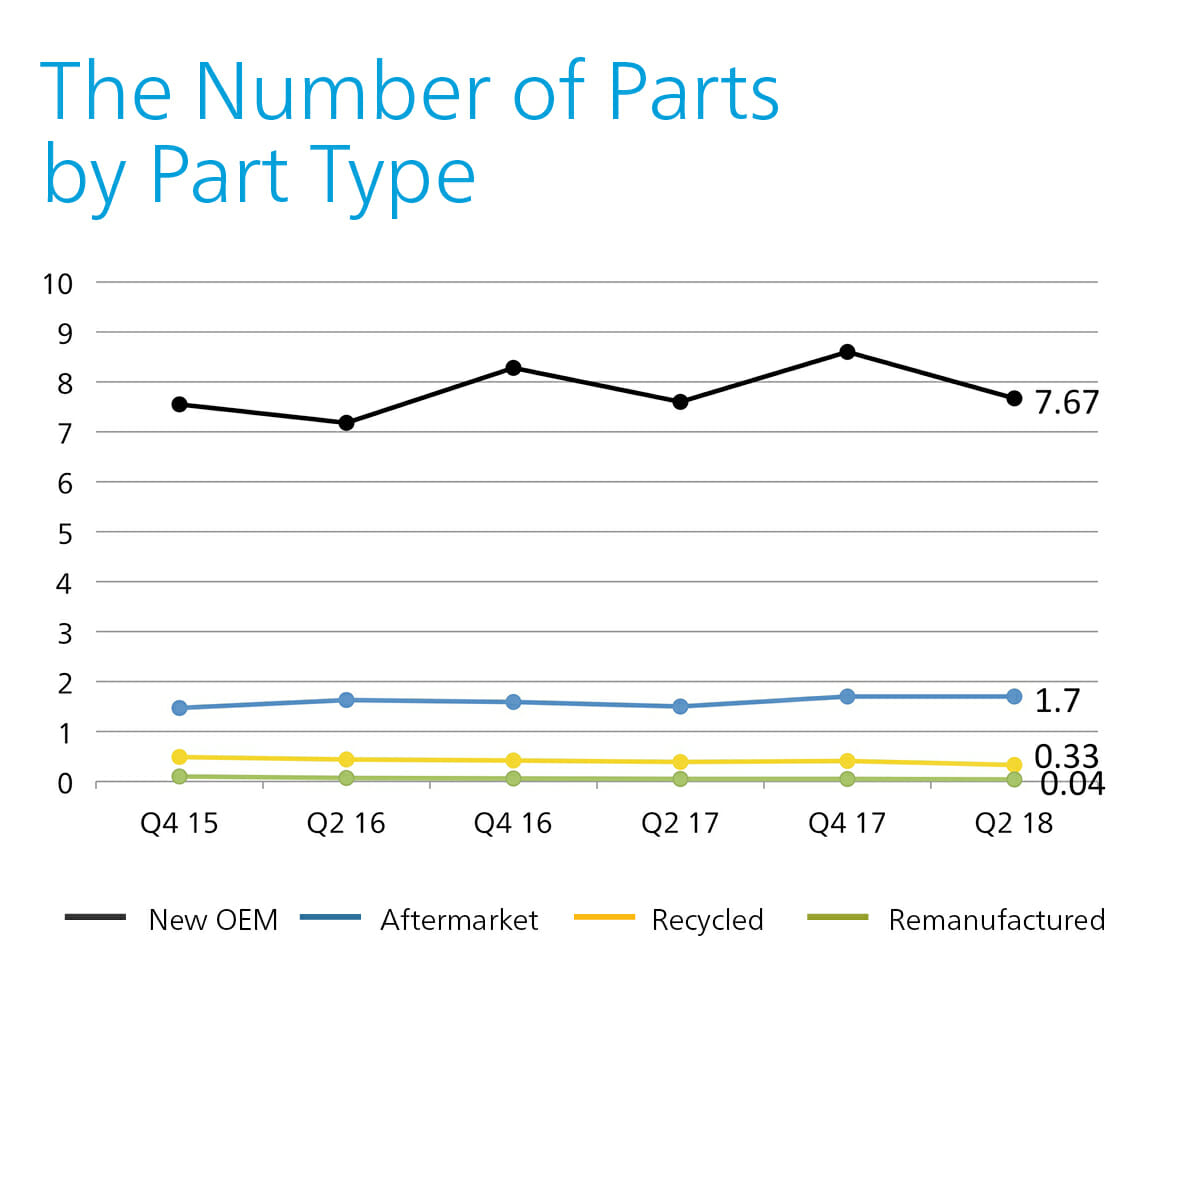
All data reflects the percentage of part-type dollars utilized in the construction of Mitchell appraisals by Canadian estimators. In Q2 2018, OEM parts use decreased slightly compared to Q2 2017.
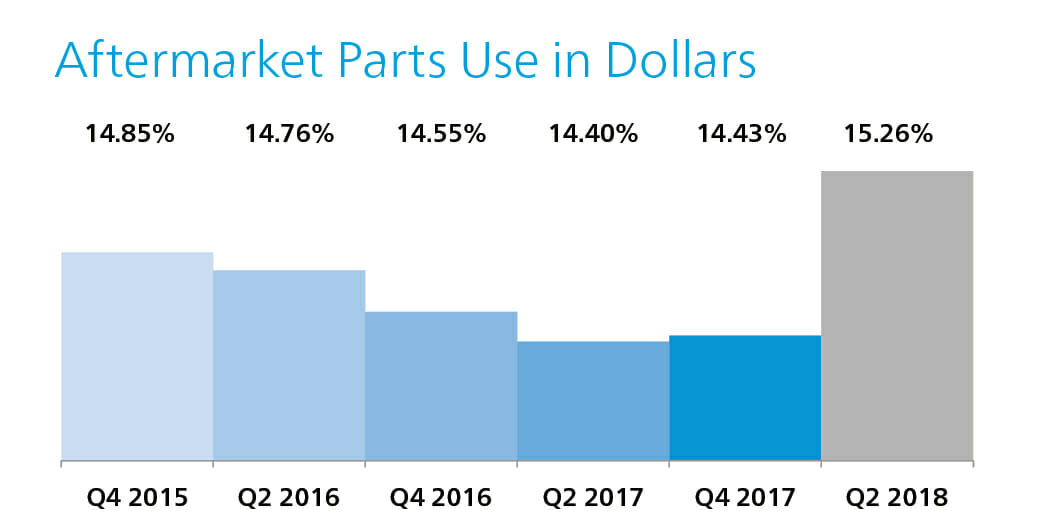
Aftermarket parts use in Q2 2018 increased compared to the same period last year, coming in at 15.26%.
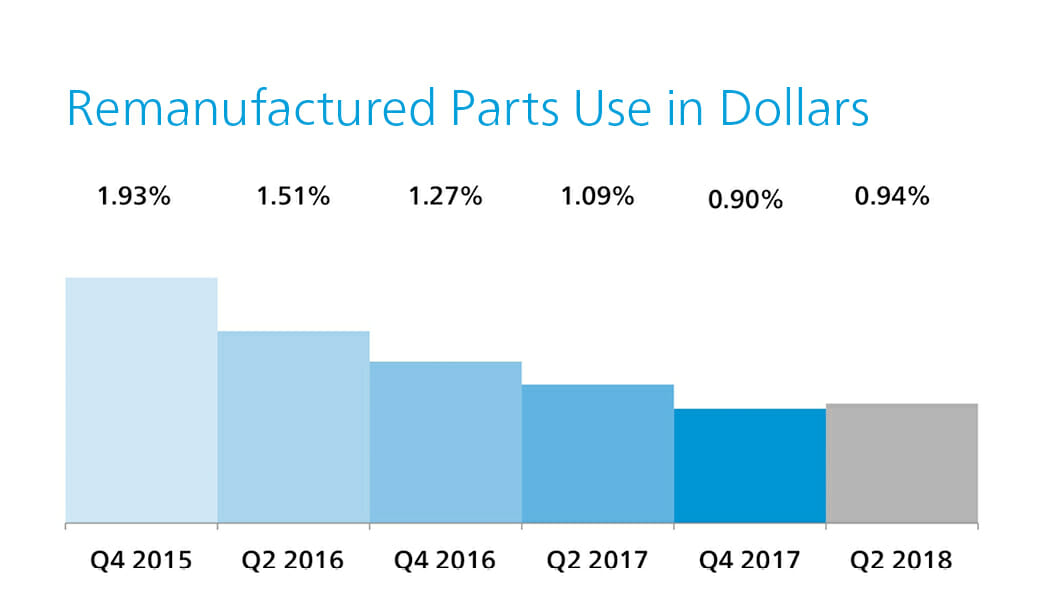
Remanufactured parts use in Canada dropped to 0.94% for Q2 2018, dropping 0.15 points compared to the same period last year.
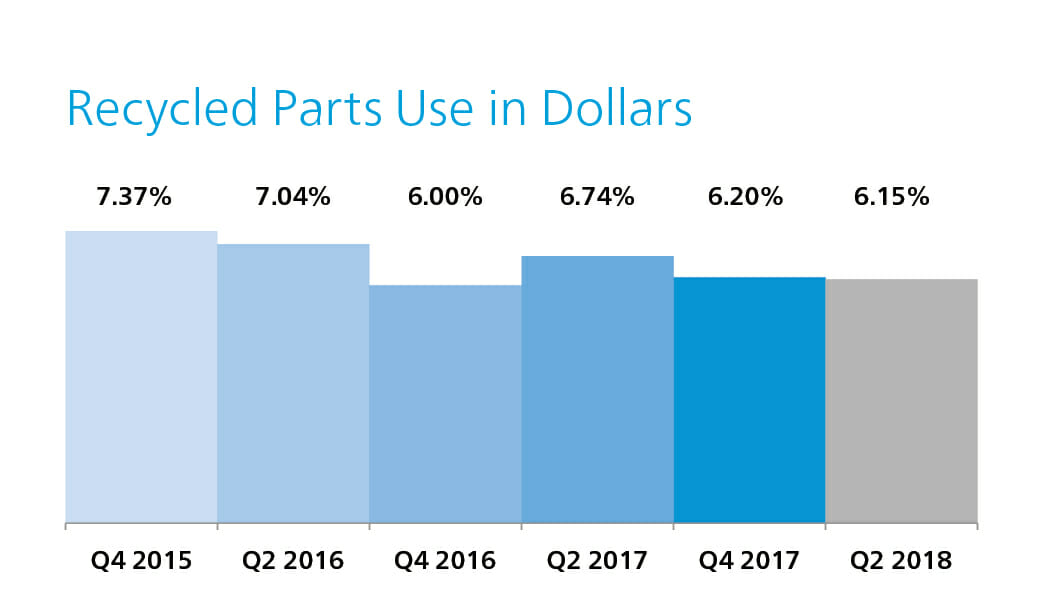
In Q2 2018, recycled parts use in Canada decreased compared to Q2 2017 results.
Canada Number of Parts by Part Type