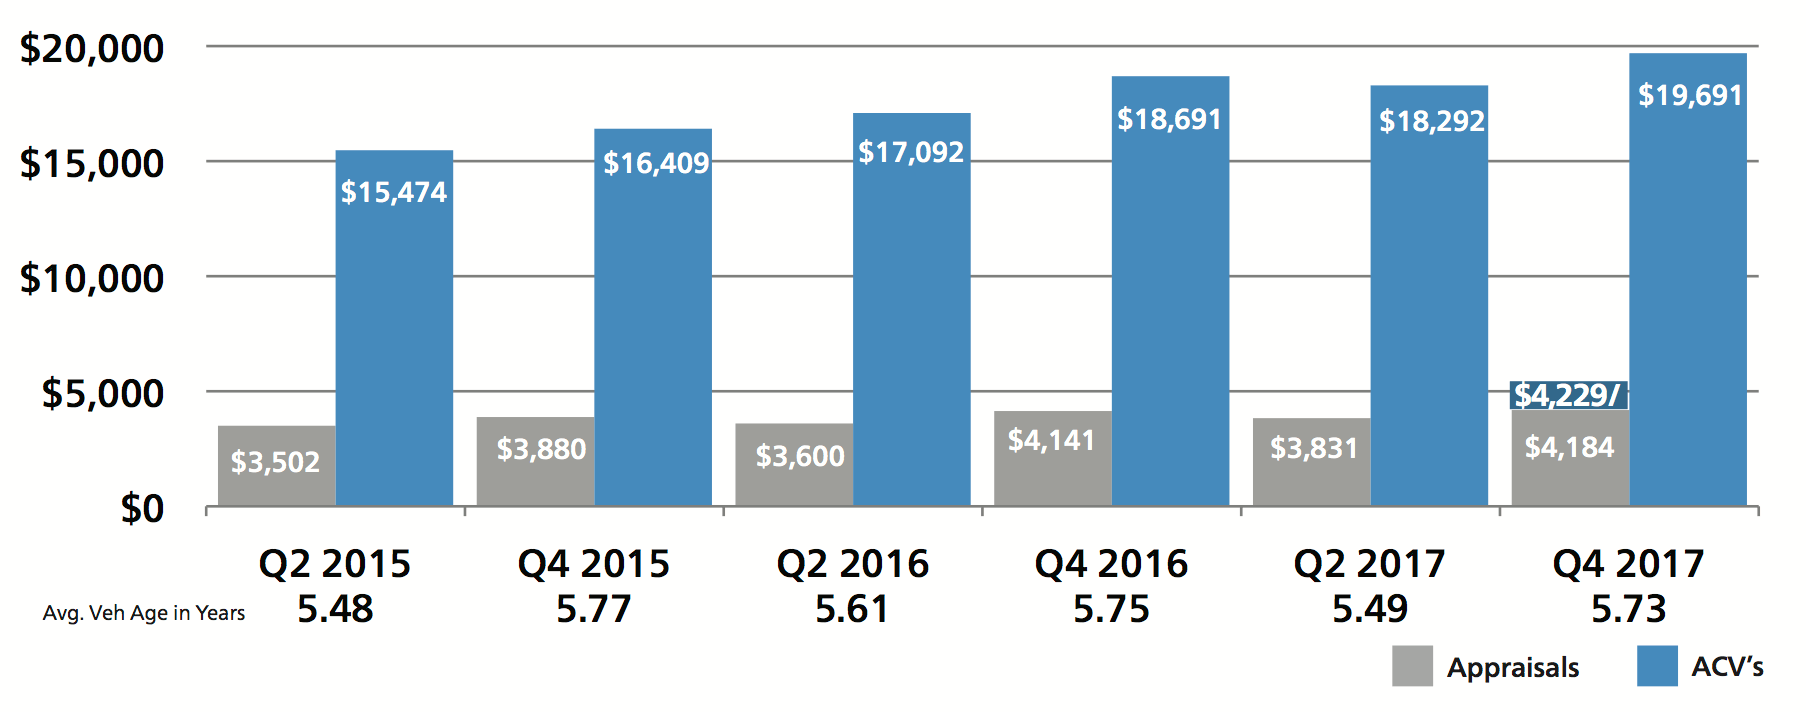
Canadian Appraisal Severity
Average Appraisal Values Severity Overall
The average gross initial appraisal value, calculated by combining data from all first and third party repairable vehicle appraisals uploaded through Mitchell Canadian systems in Q4 2017, was $4,184, a $43 increase from Q4 2016. Factoring for development yields an anticipated increase to $4,229.
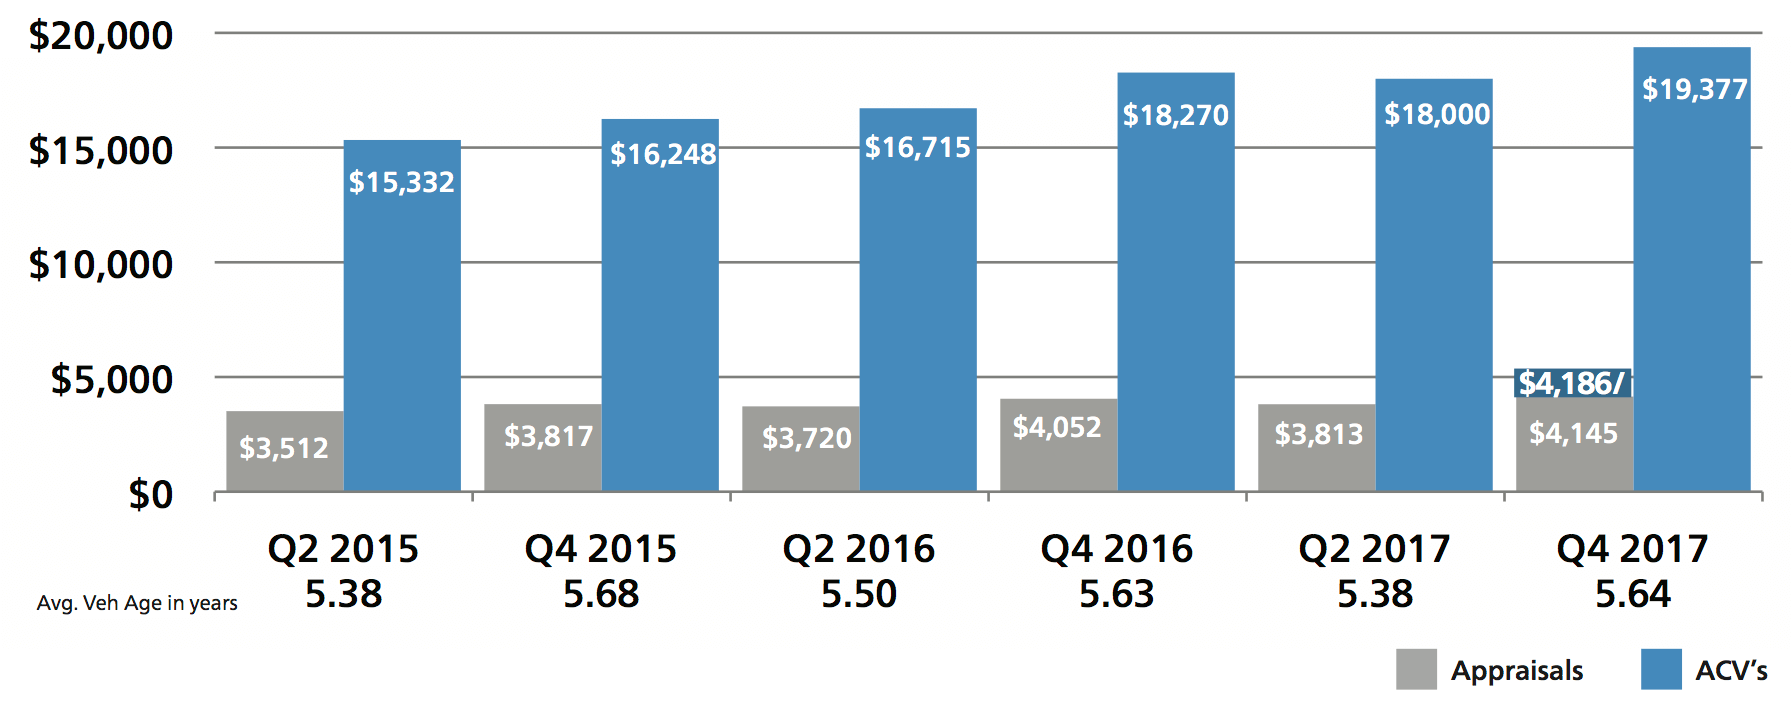
Collision Losses
The average initial gross collision appraisal value uploaded through Mitchell Canadian systems in Q4 2017 was $4,145, a $93 increase from the same period last year. Factoring for development yields an anticipated increase to $4,186, which represents a $134 increase from Q4 2016.
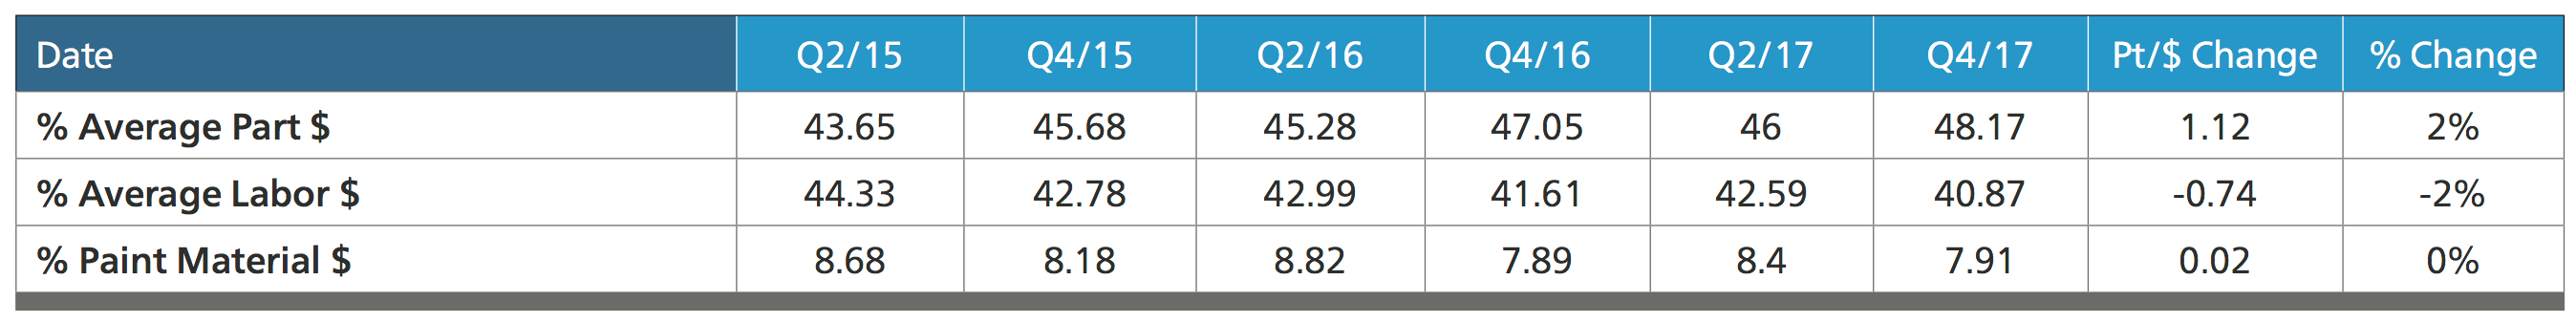
Canadian Average Appraisal Make-Up
This chart compares the average appraisal make up as a percentage of dollars. These data points reflect an increase in parts and a slight decrease in labor when comparing Q4 2017 to the same period last year.
Editors Note
Canada Segment
All dollar-figures appearing in this section are in CDN$. This data is the product of upload activity from body shops, independent appraisers, and insurance personnel, more accurately depicting insurance-paid loss activity, rather than consumer direct or retail market pricing.
Comprehensive Losses
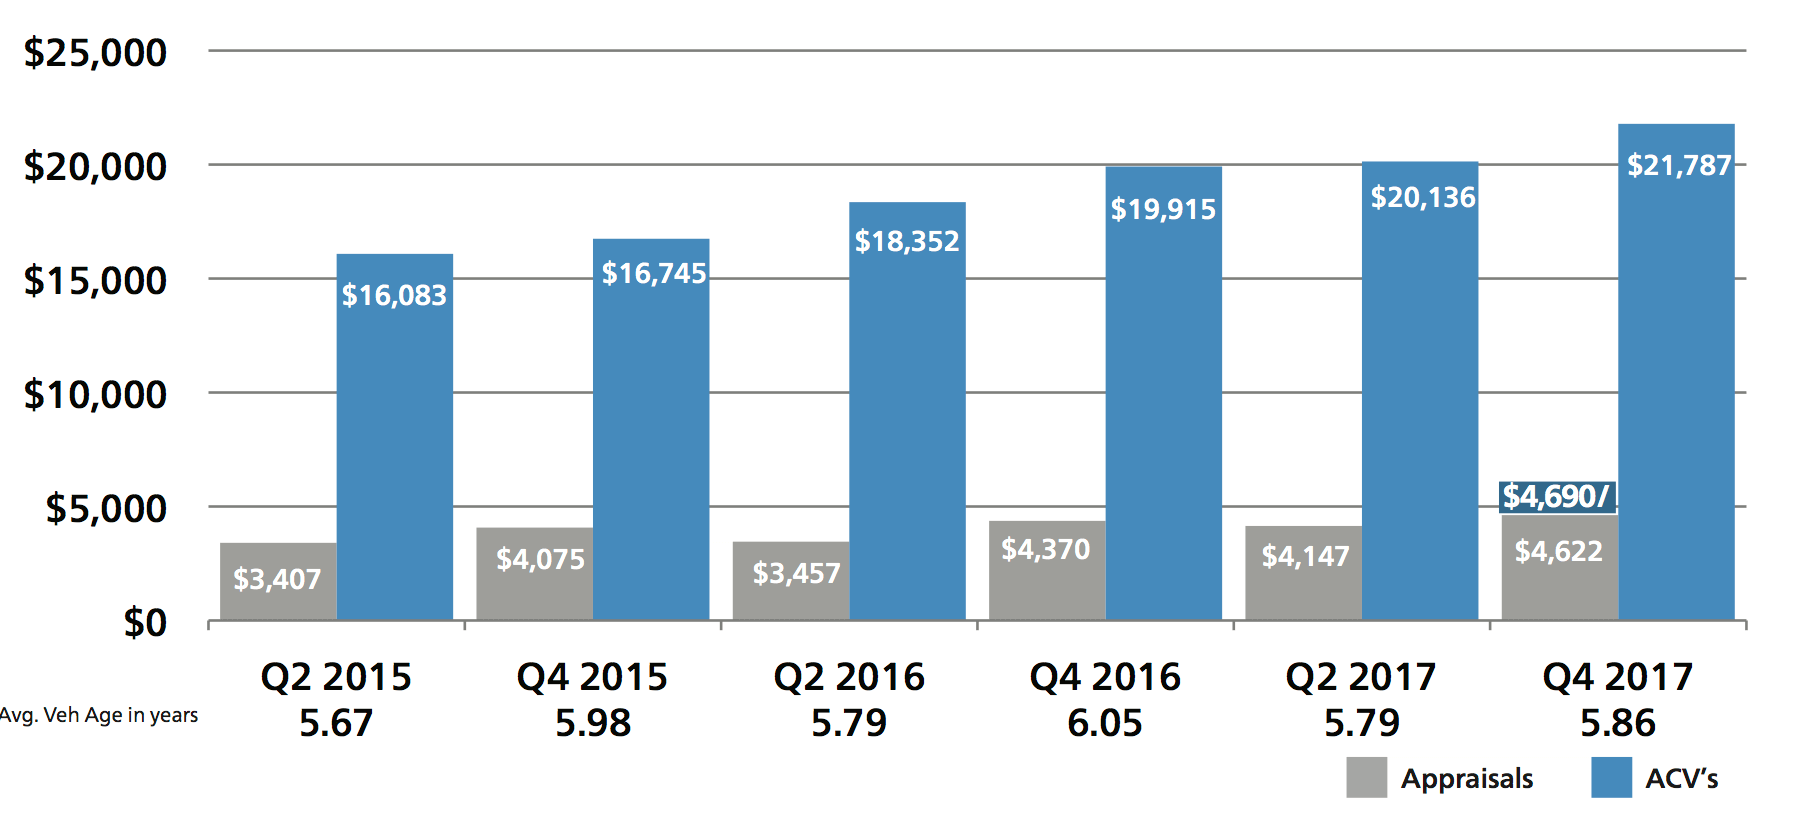
In Q4 2017, the average initial gross Canadian appraisal value for comprehensive coverage estimates processed through our servers was $4,622, which represents an increase of $252 compared to Q4 2016. Factoring for development, the anticipated final average appraisal value will be $4,690.
Third-Party Property Damage
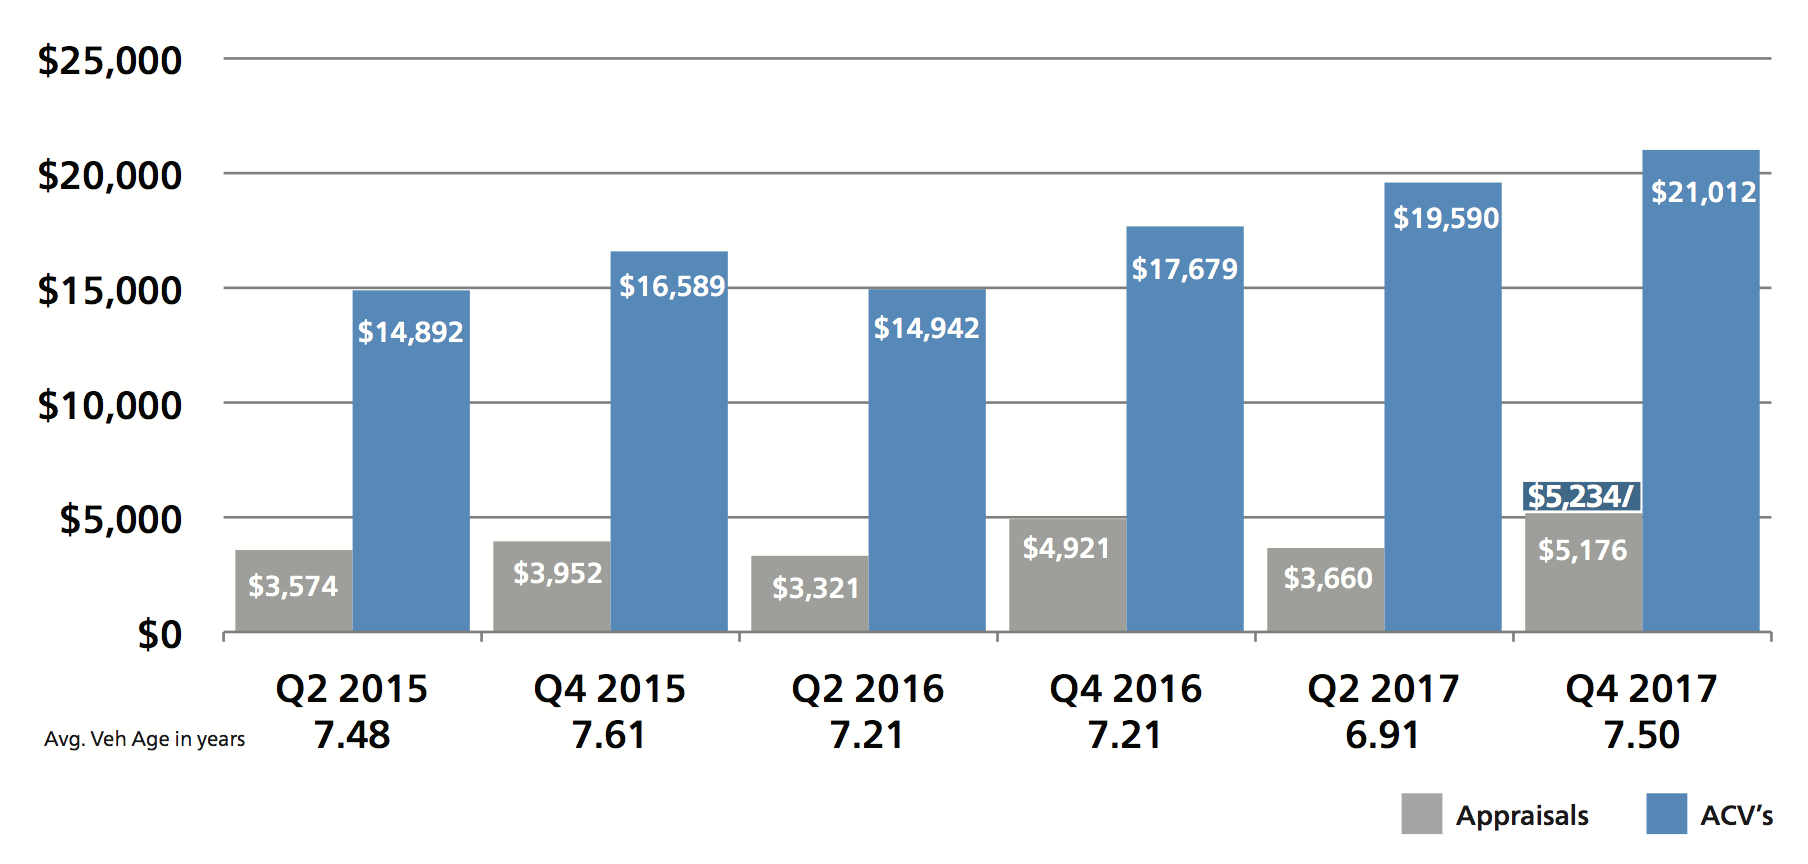
In Q4 2017, our Canadian industry initial average gross third-party property damage appraisal was $5,176, which represents an increase of $255 from Q4 2016. Factoring for development, we anticipate a final value of $5,234.
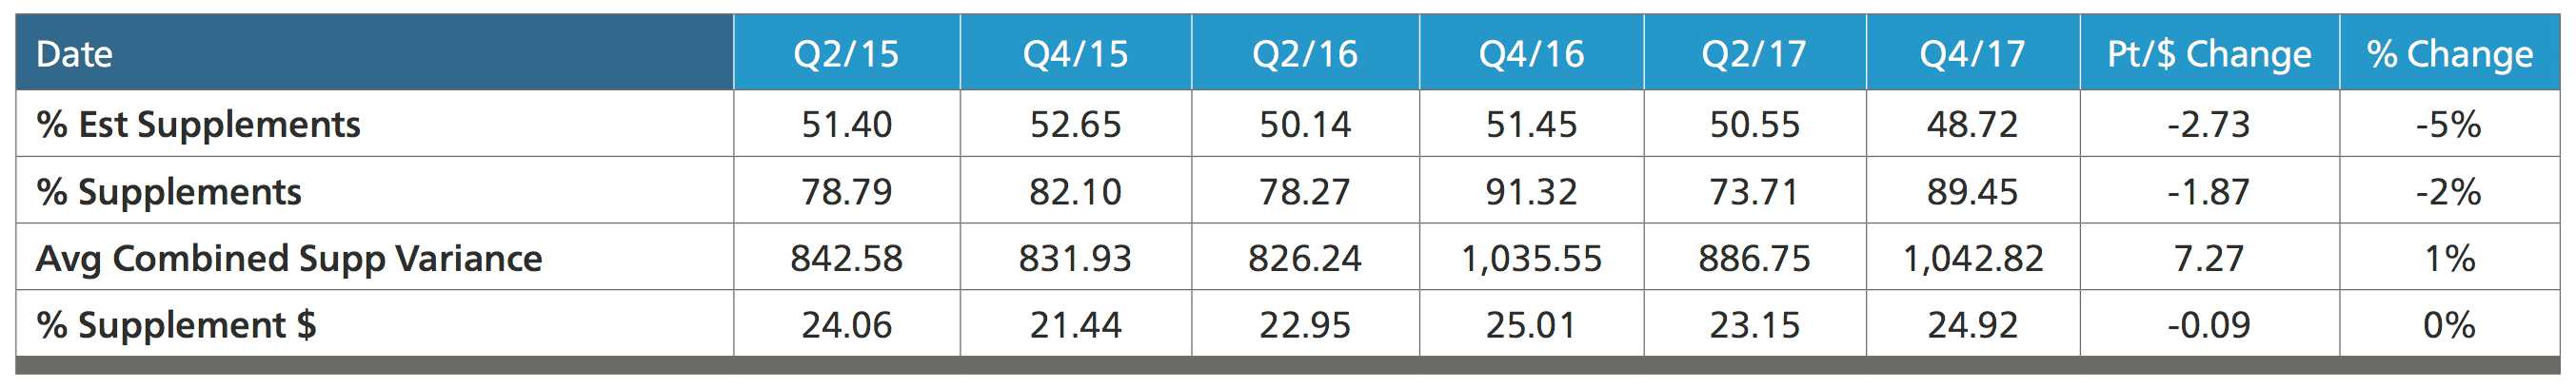
Canadian Supplements
In Q4 2017, 48.72% of all original estimates prepared by Mitchell-equipped Canadian estimators were supplemented one or more times. The average combined supplement variance for this quarter was $1,042.82, $7.27 higher than in Q4 2016.
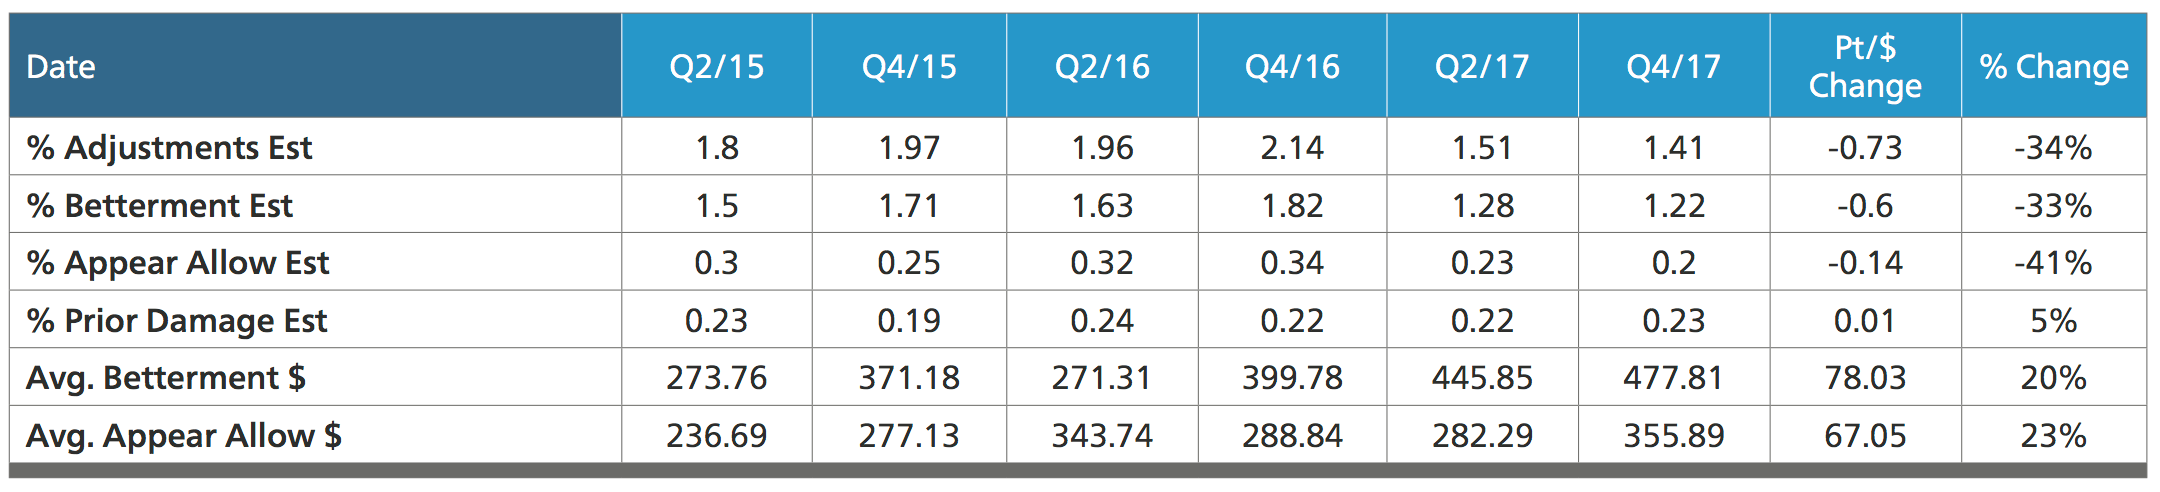
Canadian Adjustments
In Q4 2017, the average frequency of betterment taken on estimates decreased, while the dollar amount of that betterment increased to $477.81, the highest of all charted values. Appearance allowances were also down, although the dollar amount of those allowances increased by 23% when compared to Q4 2016.
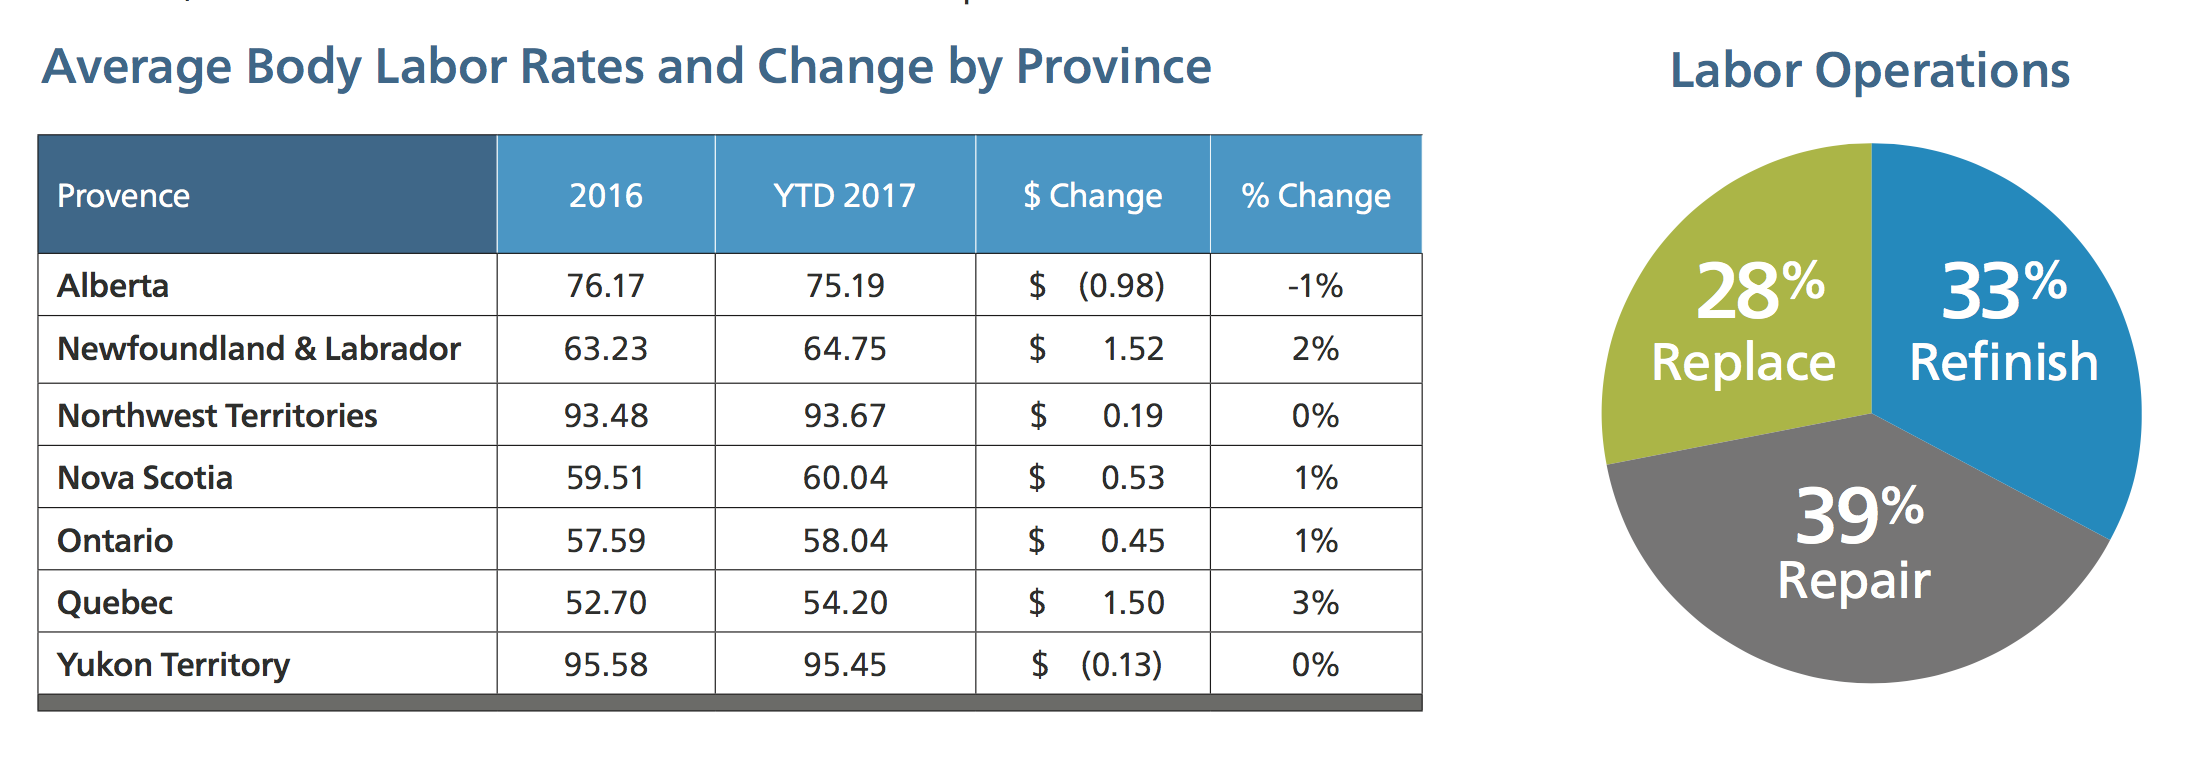
Canadian Labour Analysis
This data re ects the percentage of labor dollars utilized in the creation of Mitchell appraisals by Canadian estimators. With the exception of Alberta, labor rates increased across the other provinces and territories.
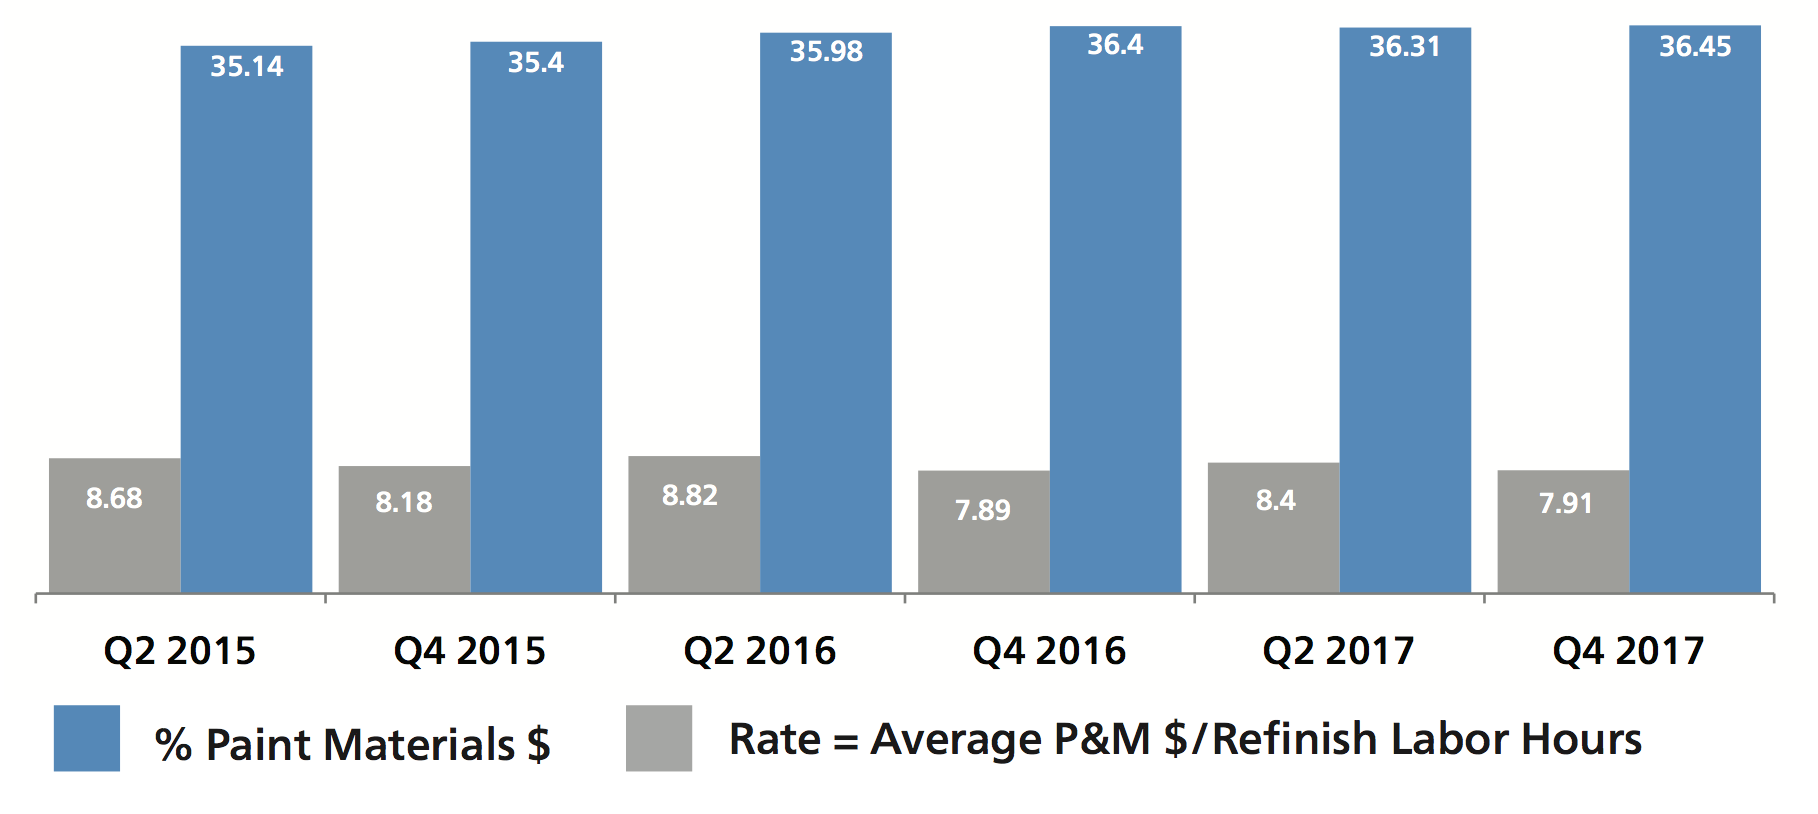
Canadian Paint and Materials
For Q4 2017, Paint and Materials made up 7.91% of our average appraisal value. Represented differently, the average paint and materials hourly rate rose slightly to $36.45 per hour compared to Q4 2016.
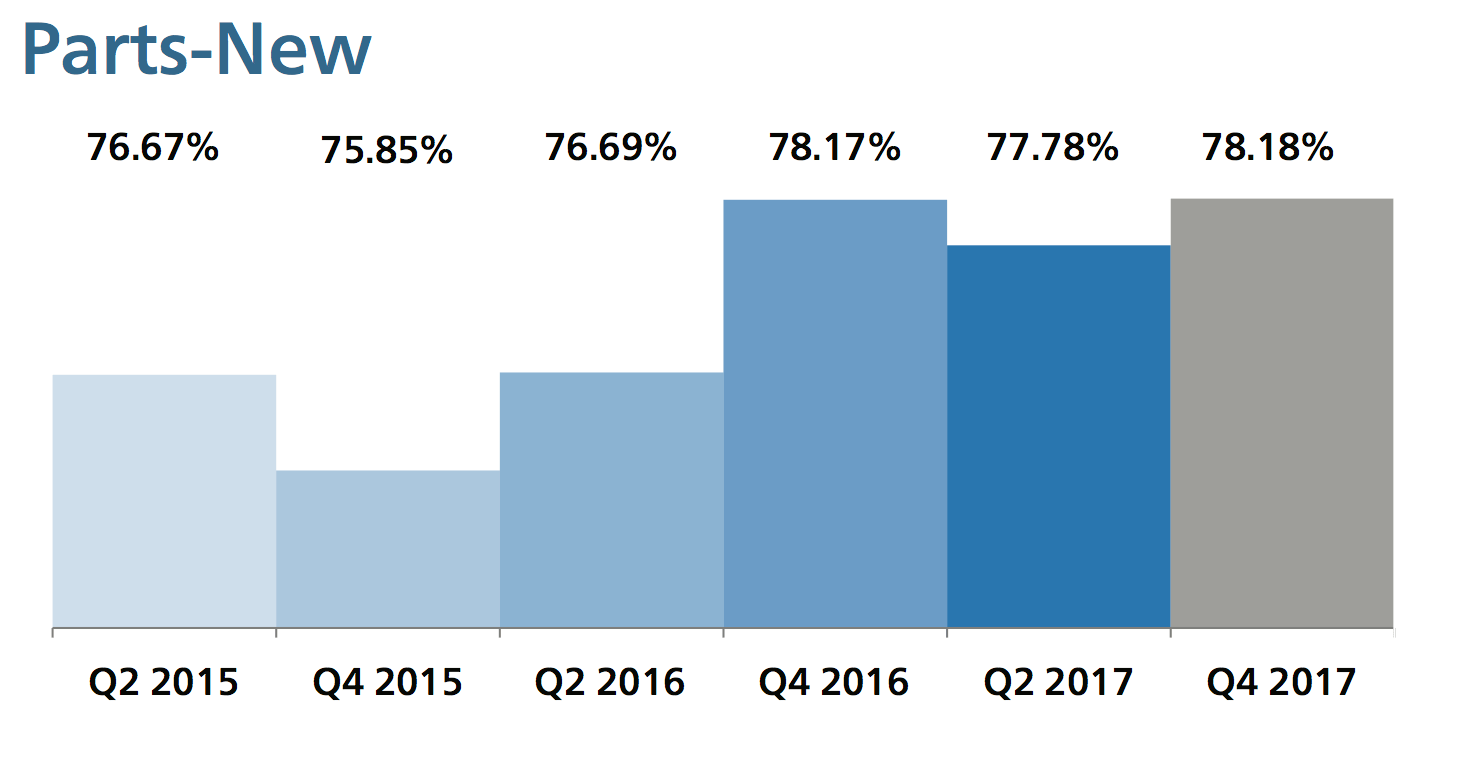
Canadian Number of Parts by Part Type
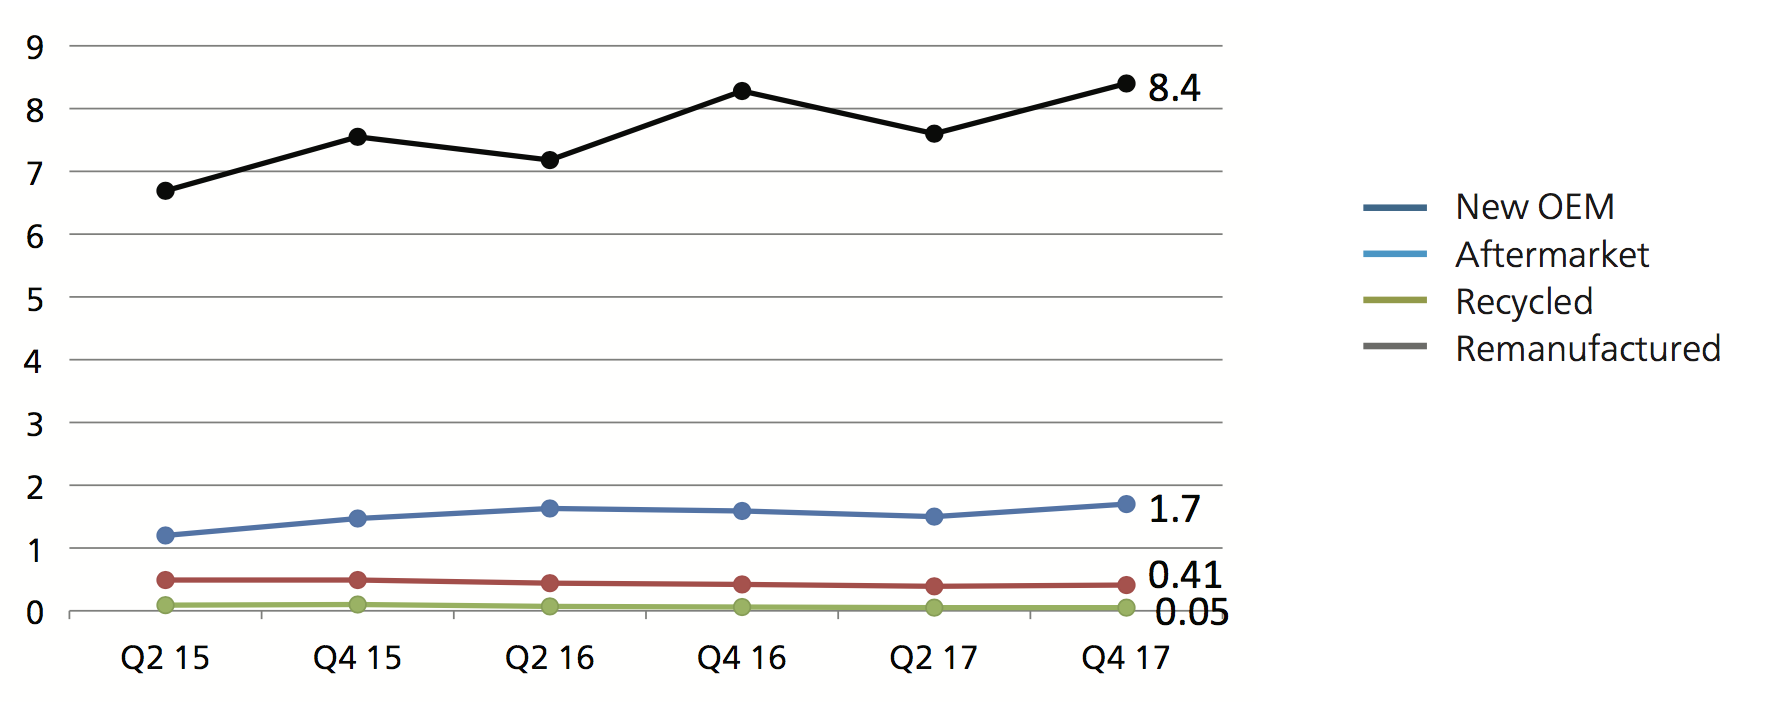
Canadian Parts Utilization
All data reflects the percentage of part-type dollars utilized in the construction of Mitchell appraisals by Canadian estimators.
Original Equipment Manufacturer (OEM) Parts Use in Dollars
In Q4 2017, OEM parts use was steady compared to Q4 2016.
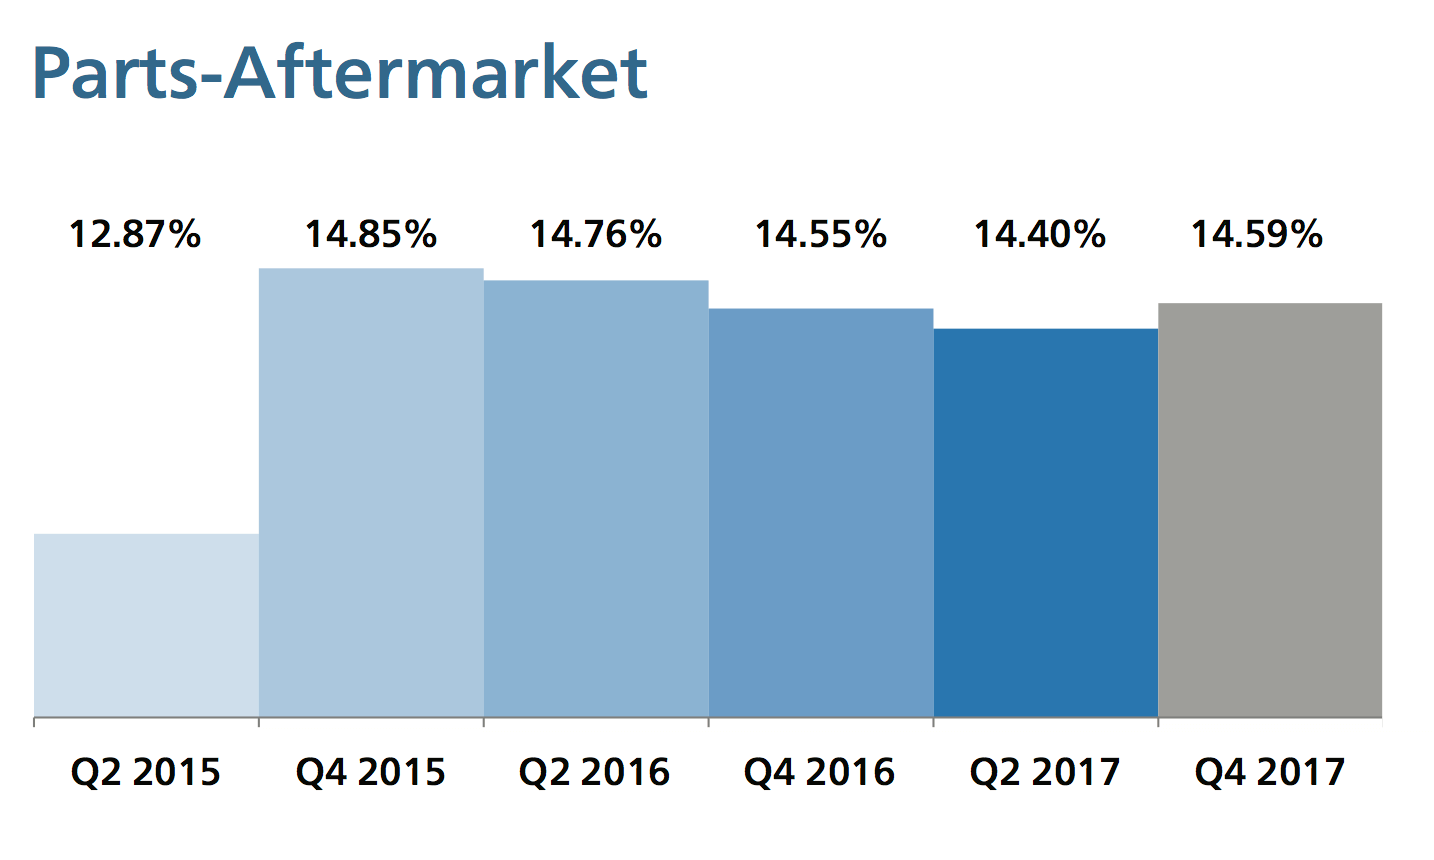
Aftermarket Parts Use in Dollars
Aftermarket parts use in Q4 2017 increased slightly compared to the same period last year, coming in at 14.59%.
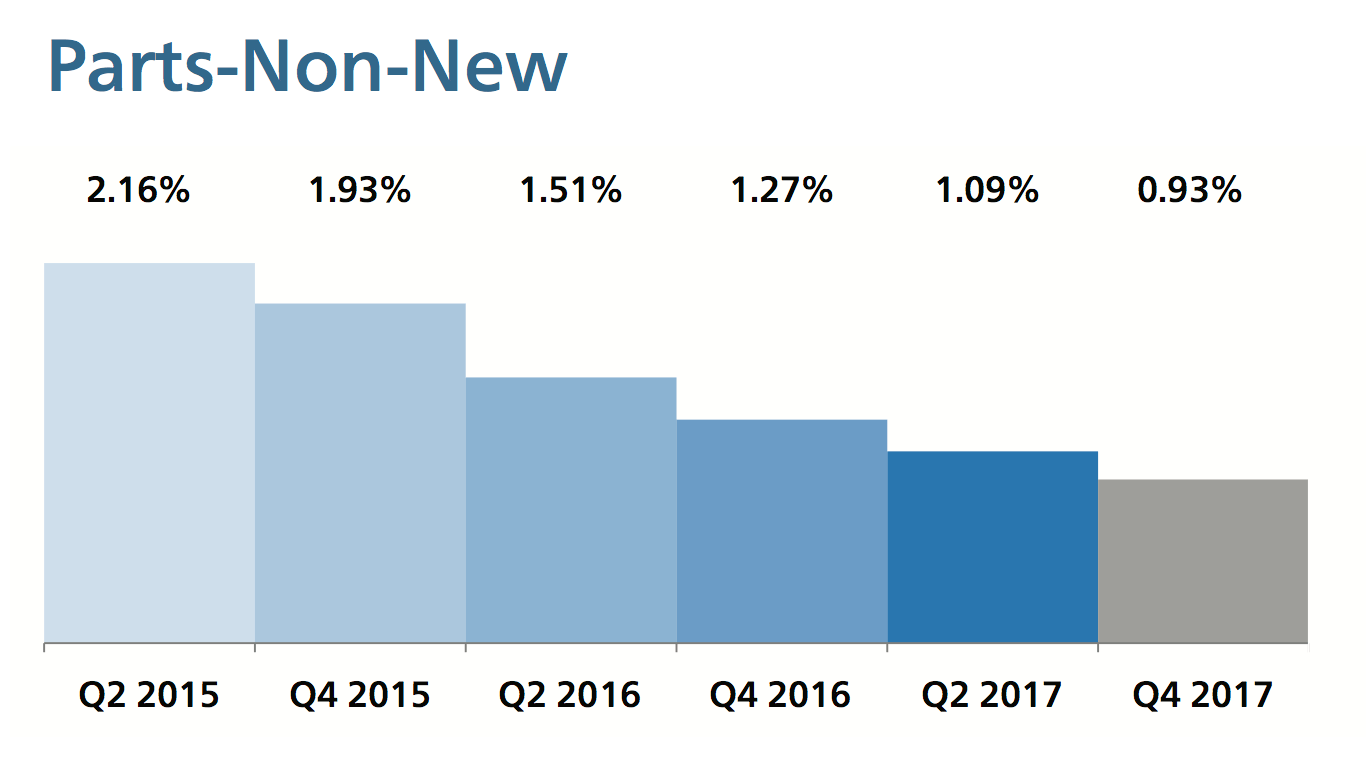
Remanufactured Parts Use in Dollars
Remanufactured parts use in Canada dropped to 0.93% for Q4 2017, which represents the lowest percentage of part dollars in the charted quarters.
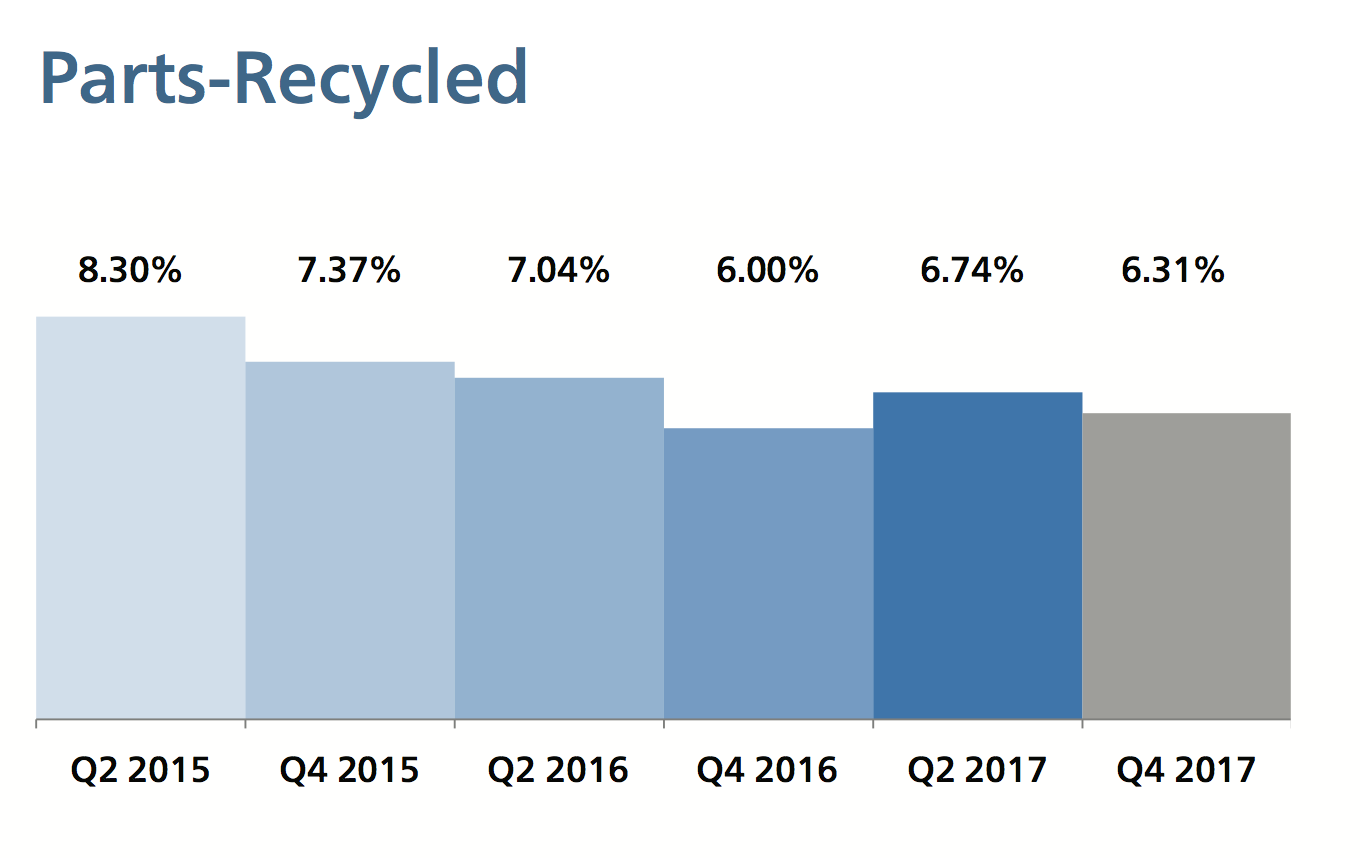
Recycled Parts Use in Dollars
In Q4 2017, recycled parts use in Canada increased as a percentage of part dollars when compared to Q4 2016.