Adjustments
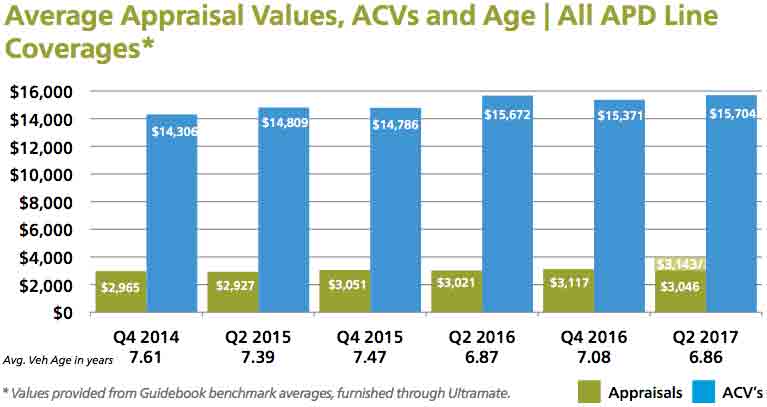
The initial average appraisal value, calculated by combining data from all first and third-party repairable vehicle appraisals uploaded through Mitchell systems in Q2 2017, was $3,046. Continued development suggests a final Q2 2017 average appraisal value of $3,143, which represents an increase of $122 compared to the same quarter last year.
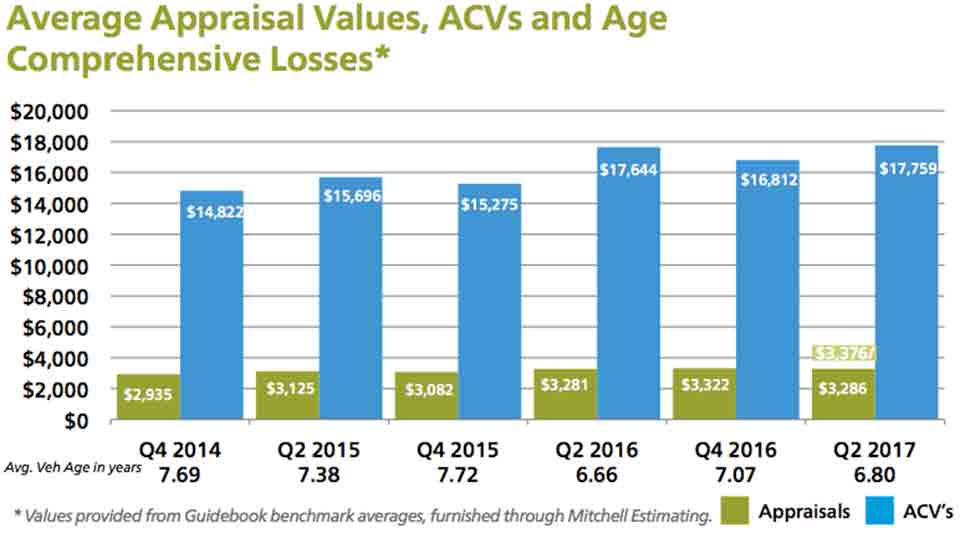
Comprehensive Losses
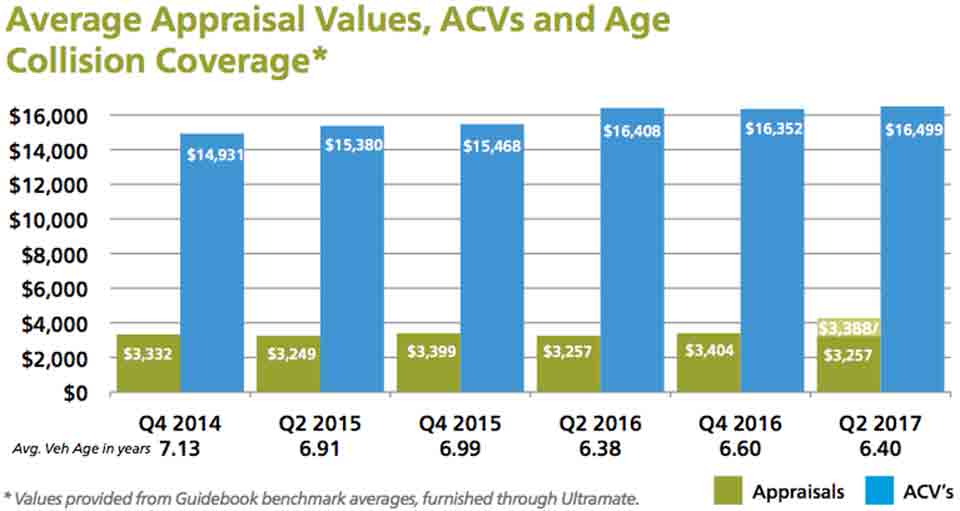
In Q2 2017, the average initial gross appraisal value for comprehensive coverage estimates processed through our servers was $3,286, compared to $3,281 in Q2 2016. Factoring for development produces an increase in the adjusted value to $3,376.

Mitchell Estimating is an advanced estimating system, combining database accuracy, automated calculations, and repair procedure pages to produce estimates that are comprehensive, verifiable, and accepted throughout the collision industry. Mitchell Estimating is an integral part of Mitchell’s appraisal workflow solutions. Visit Mitchell’s website at www.mitchell.com.
Collision Losses
Mitchell’s Q2 2017 data reflects an initial average gross collision appraisal value of $3,257, which matches the same period last year. However, continued development suggests a final Q2 2017 average gross collision appraisal value of $ 3,388, which represents an increase of $131 over the same quarter last year.
Third-Party Property Damage
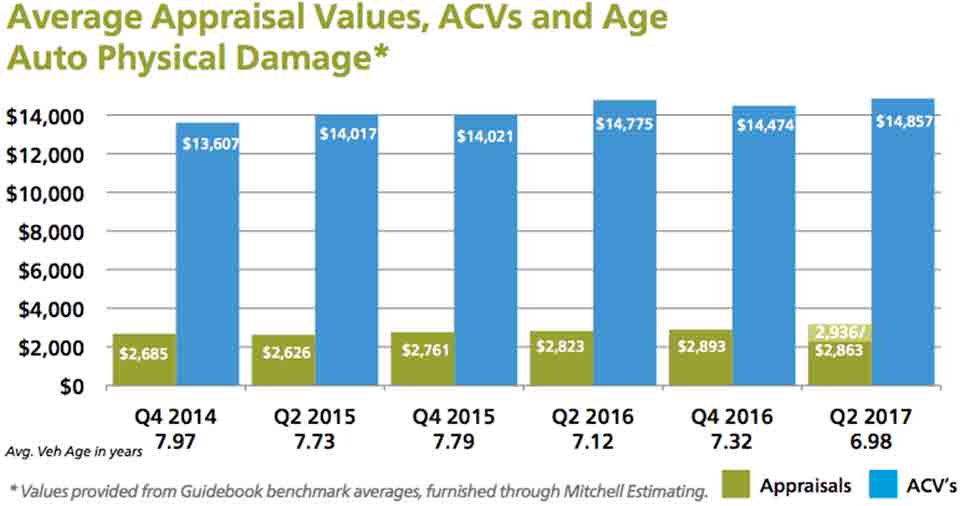
In Q2 2017, our initial average gross third-party property damage appraisal was $2,863 compared to $2,823 in Q2 2016, reflecting a $40 initial increase between these respective periods. Factoring for development yields an anticipated Q2 2017 adjusted appraisal value of $ 2,936, a $113 increase in average severity over Q2 2016.
Supplements
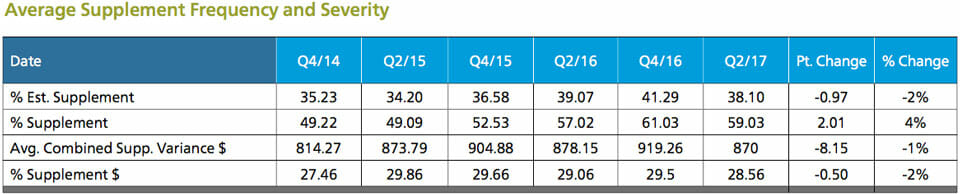
As it generally takes at least three months following the original date of appraisal to accumulate most supplements against an original estimate of repair, we report (and recommend viewing supplement information) three months’ after-the-fact, to obtain the most accurate view of this data.
In Q2 2017, 38.1% of all original estimates prepared by Mitchell-equipped estimators were supplemented one or more times. In this same period, the pure supplement frequency (supplements to estimates) was 59.03%, reflecting a 2.01 point increase from that same period in 2016. The average combined supplement variance for this quarter was $870, $8.15 lower than in Q2 2016.
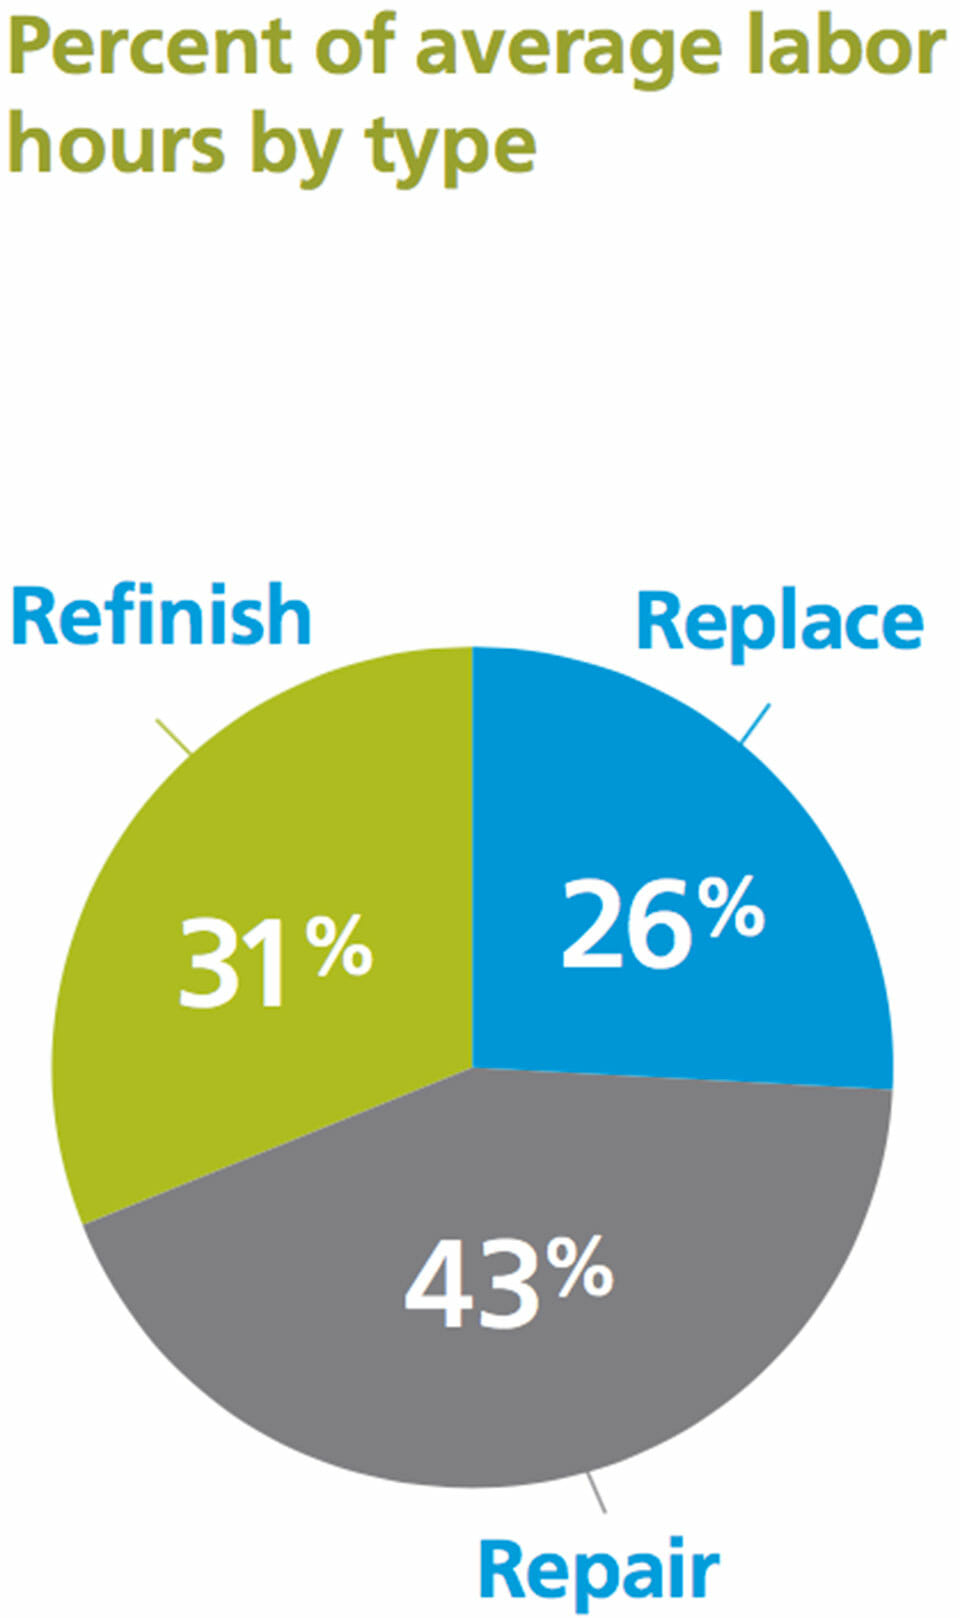
Average Appraisal Make-Up
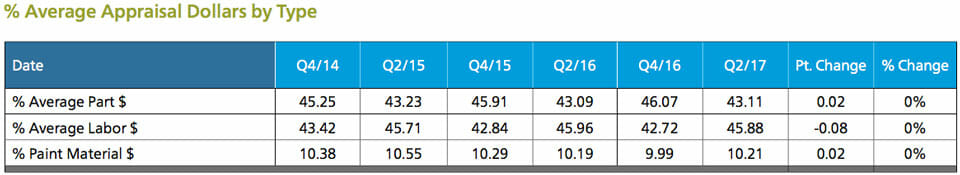
This chart compares the average appraisal make-up as a percentage of dollars, constructed by Mitchell- equipped estimators. These data points reflect a ‘trade o ’; in comparing Q2 2017 to the same period last year, there was only minimal shifting (less than 1%) between categories.
Parts Analysis
Parts Type Definitions
Original Equipment Manufacturer (OEM):
Parts produced directly by the vehicle manufacturer or their authorized supplier, and delivered through the manufacturer’s designated and approved supply channels. This category covers all automotive parts, including sheet metal and mechanical parts.
Aftermarket:
Parts produced and/or supplied by firms other than the Original Equipment Manufacturer’s designated supply channel. This may also include those parts originally manufactured by endorsed OEM suppliers, which have later followed alternative distribution and sales processes. While this part category is often only associated with crash replacement parts, the automotive aftermarket also includes a large variety of mechanical and custom parts.
Non-New/Remanufactured:
Parts removed from an existing vehicle that are cleaned, inspected, repaired and/or rebuilt, usually back to the original equipment manufacturer’s specifications, and re-marketed through either the OEM or alternative supply chains. While commonly associated with mechanical hard parts such as alternators, starters and engines, remanufactured parts may also include select crash parts such as urethane and TPO bumpers, radiators and wheels.
Recycled:
Parts removed from a salvaged vehicle and re-marketed through private or consolidated auto parts recyclers. This category commonly includes all types of parts and assemblies, especially body, interior and mechanical parts.
While there isn’t a perfect correlation between the types of parts specified by estimators and those actually used during the course of repairs, we feel that the following observations are directionally accurate for both the insurance and auto body repair industries. This section illustrates the percentage of dollars allocated to each unique part-type.As a general observation, recent data show that parts make up 46% of the average value per repairable vehicle appraisal, which represents over $1,400 in average spend per estimate.
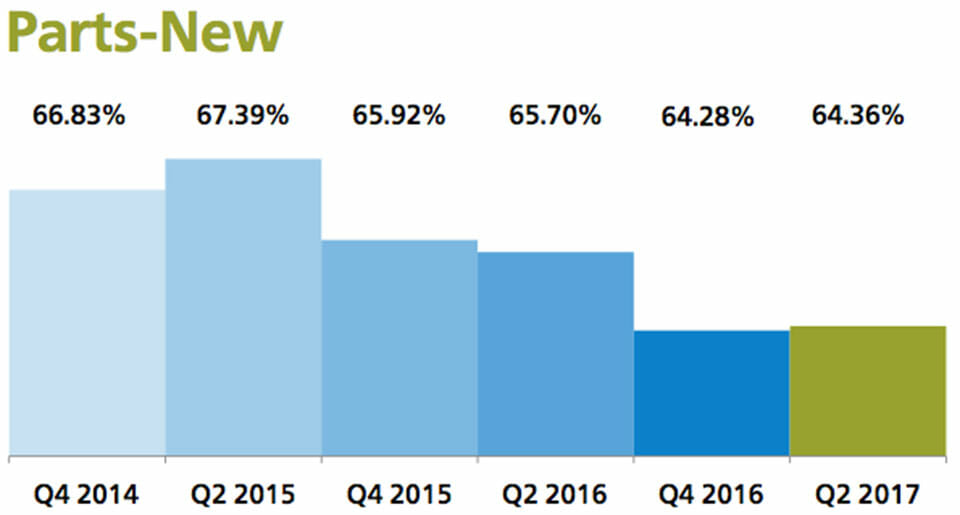
Original Equipment Manufacturer (OEM) Parts Use in Dollars
In Q2 2017, OEM parts represented 64.36% of all parts dollars specified by Mitchell-equipped estimators. This represents a 1.34% relative decrease from Q2 2016.
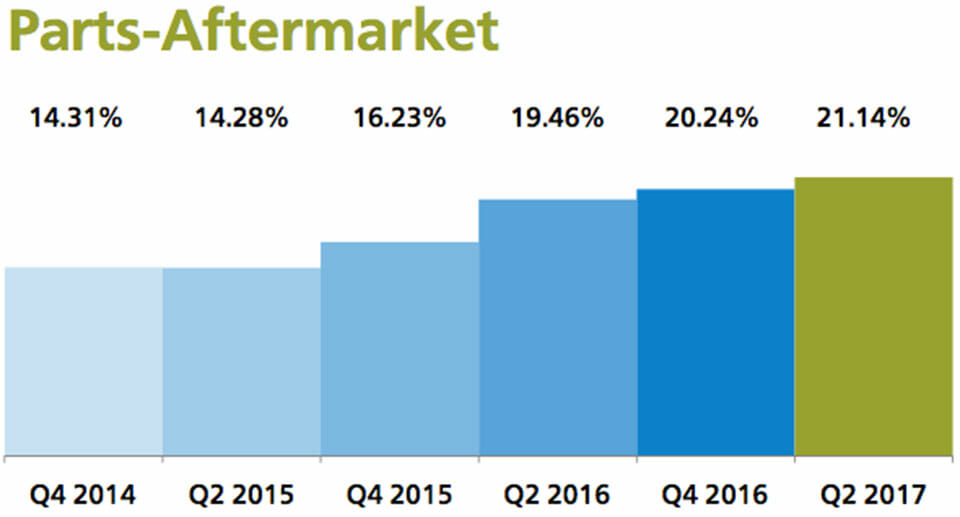
Aftermarket Parts Use in Dollars
In Q2 2017, 21.14% of all parts dollars recorded on Mitchell appraisals were attributed to Aftermarket sources, up 1.68 points from Q2 2016.
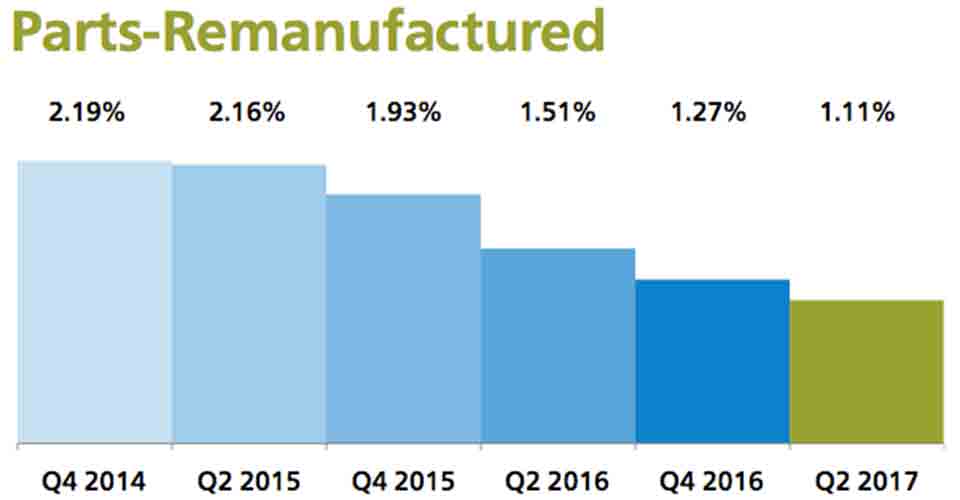
Remanufactured Parts Use in Dollars
Currently listed as “Non-New” parts in our estimating platform and reporting products, Remanufactured parts currently represent 3.82% of the average gross parts dollars used in Mitchell appraisals during Q2 2017. This reflects a decrease over this same period in 2016.
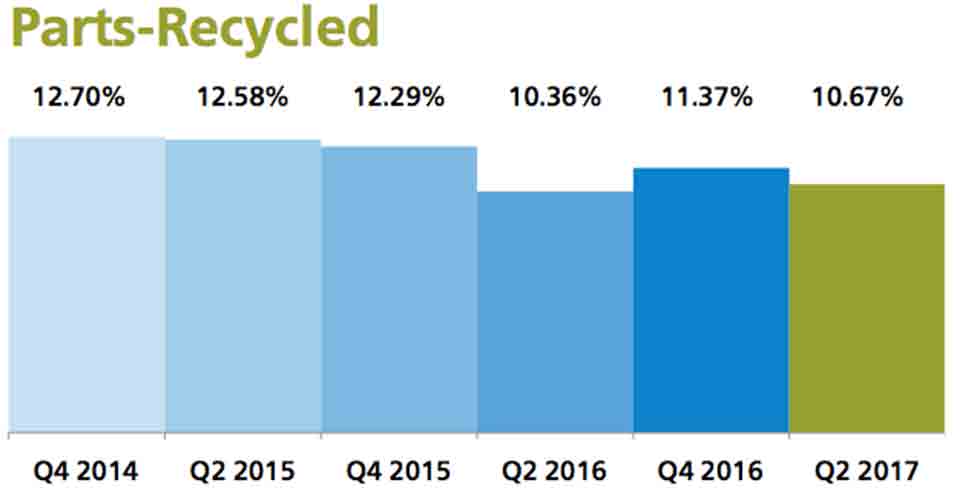
Recycled Parts Use in Dollars
Recycled parts constituted 10.67% of the average parts dollars used per appraisal during Q2 2017, reflecting a slight increase from Q2 2016.
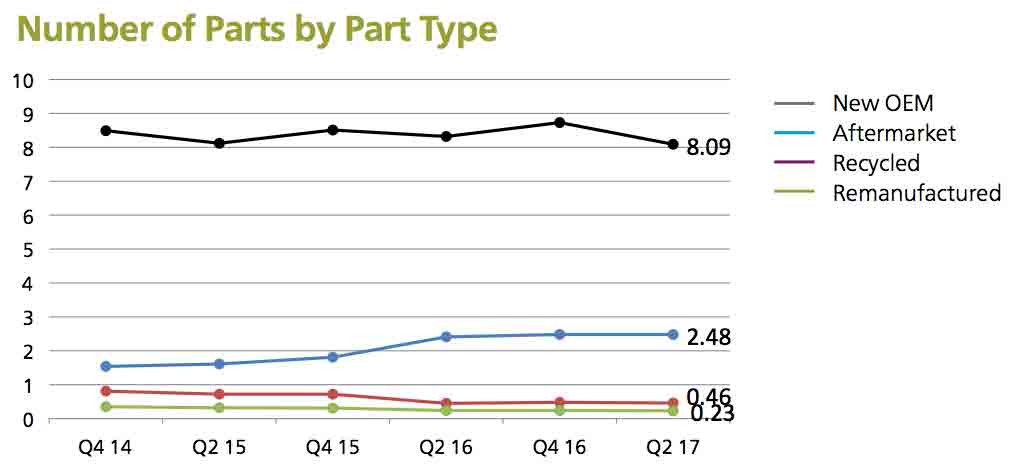
The Number of Parts by Part Type
In order to capture another aspect of parts use, we calculate the number of parts used by part type on a repairable estimate. In comparing Q2 2017 to the same quarter in 2016, aftermarket parts usage increased to an average 2.48 parts per estimate, while new OEM parts usage decreased.
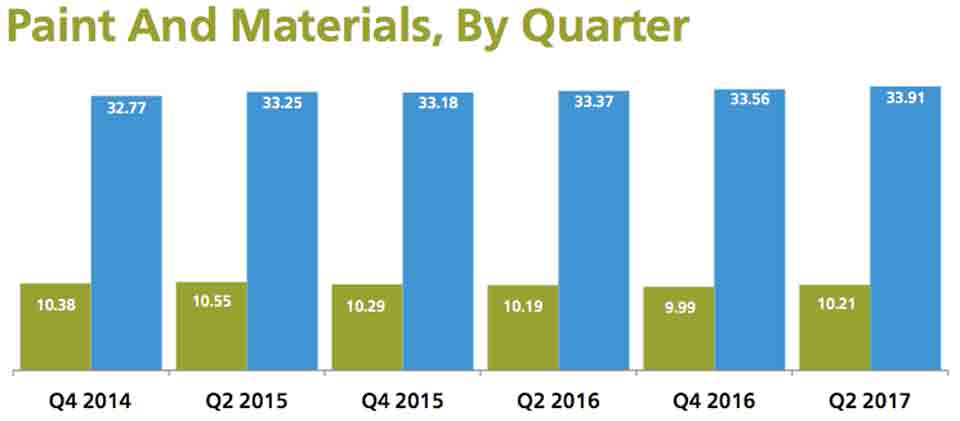
Paint and Materials
During Q2 2017, Paint and Materials made up 10.21% of our average appraisal value, representing a slight increase from Q2 2016. Represented di erently, the average paint and materials rate— achieved by dividing the average paint and materials allowance per estimate by the average estimate refinish hours—yielded a rate of $33.91 per refinish hour in this period, compared to $33.37 in Q2 2016.
Mitchell’s Refinishing Materials Calculator (RMC) provides accurate calculations for refinishing materials costs by incorporating a database of more than 8,500 paint codes from eight paint manufacturers. It provides job-specific materials costing according to color and type of paint, plus access to the only automated, accurate, field-tested, and industry-accepted breakdown of actual costs of primers, colors, clear coats, additives and other materials needed to restore vehicles to pre-accident condition. For more information on RMC, visit Mitchell’s website at www.mitchell.com.
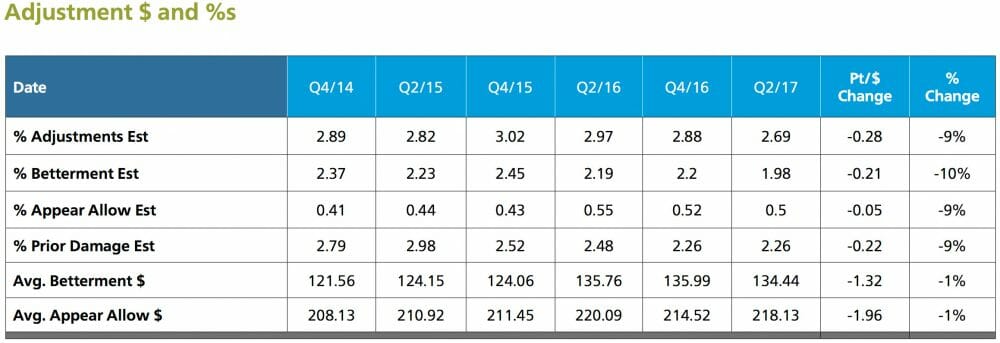
Adjustments
In Q2 2017, the percentage of adjustments made to estimates was down compared to the same period last year. The frequency of betterment taken decreased by 10%, while the average dollar amount of the betterment taken decreased by 1% to $134.44. Appearance allowance frequency decreased by 9%, while the dollar amount of that appearance allowance decreased to $218.13.
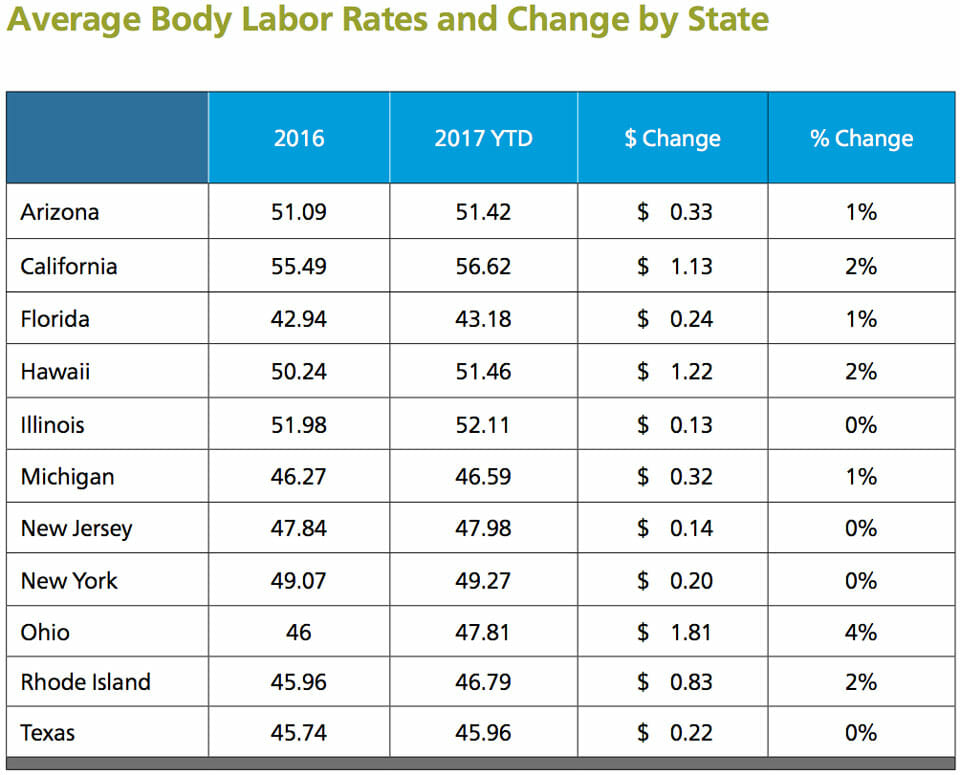
Labor Analysis
For YTD 2017, average body labor rates have risen across all survey states compared to 2016.