


Ryan Mandell
Director of Claims Performance, Auto Physical Damage, Mitchell, An Enlyte Company
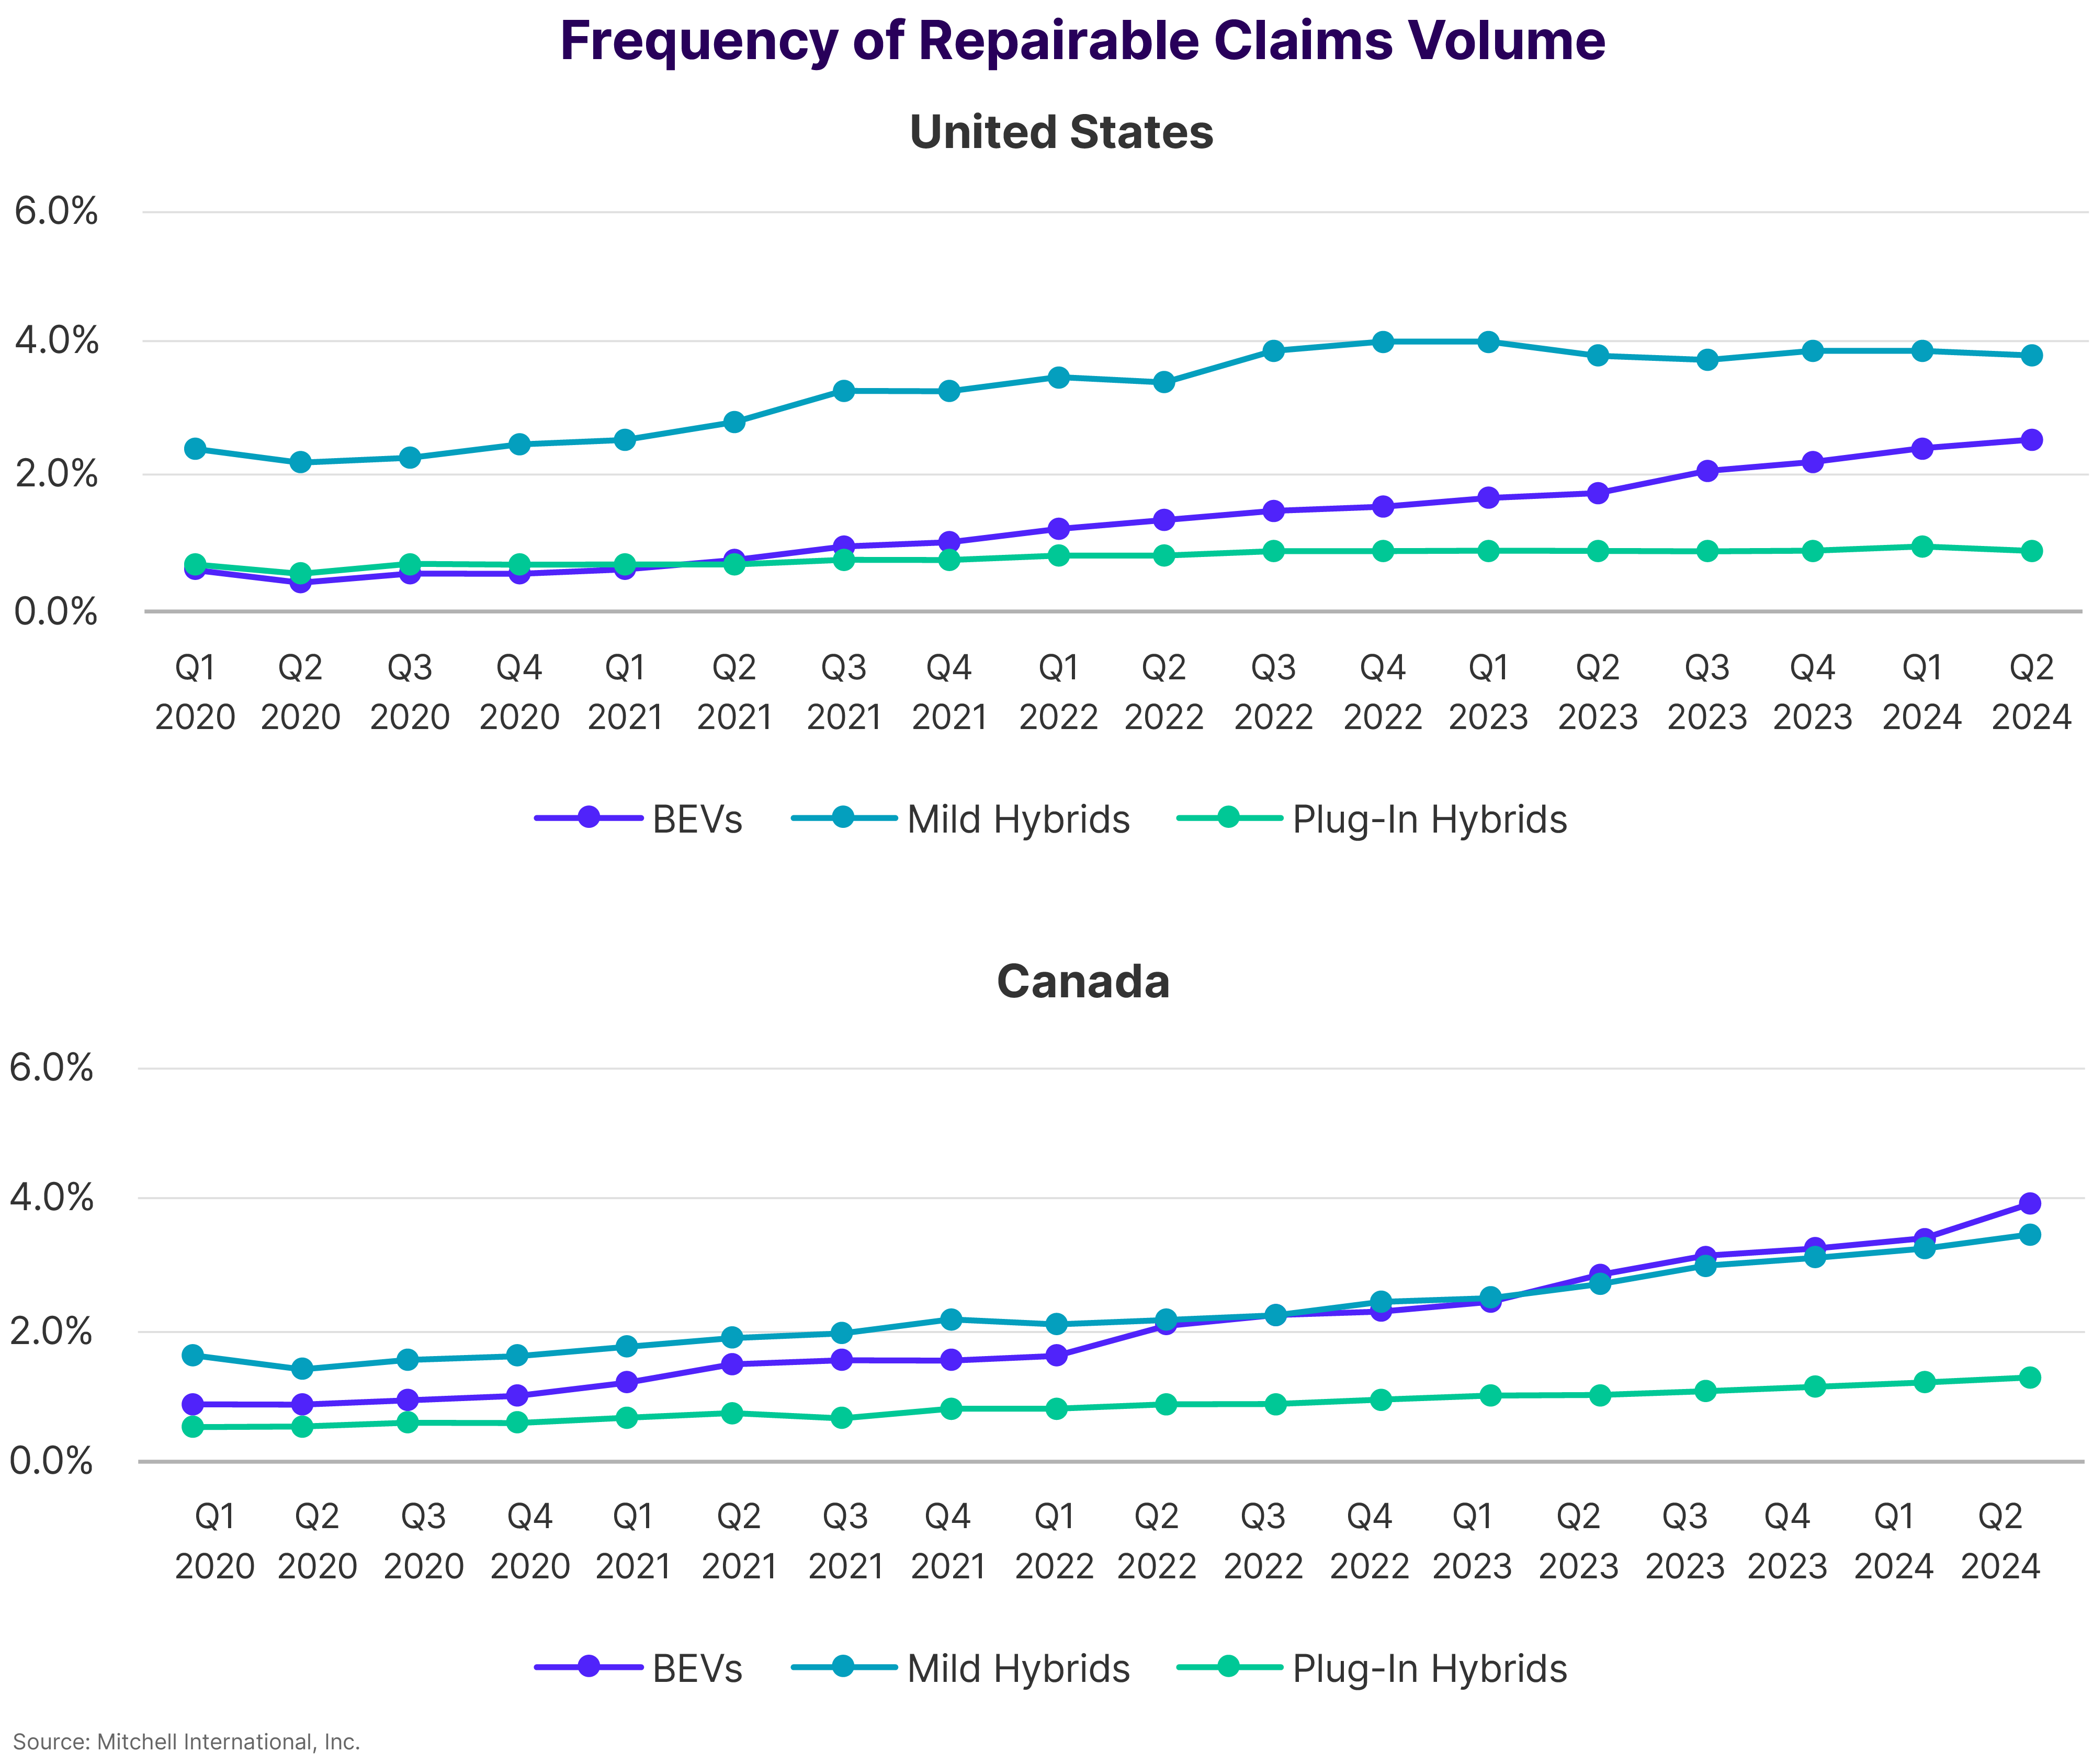
Claims frequency for repairable, collision-damaged battery electric vehicles (BEVs) rose to 2.5% in the U.S. and 3.94% in Canada in Q2 2024—a year-over-year increase of 45% and 39% respectively. According to the Alliance for Automotive Innovation, EVs represented 9.3% of new U.S. light-duty vehicle sales in Q1 2024, down from 10.2% in Q4 2023. Similarly, in Canada BEV sales fell to 9.2% last quarter, down from 10% in Q4 2023. S&P Global attributes this “cooling off” period to “market saturation, consumers waiting for new models, or economic factors that might have influenced purchasing decisions”. It remains to be seen whether the decline in sales is temporary or, instead, reflects a broader shift in consumer sentiment.
While BEV sales have slowed this year, hybrid vehicle sales remain robust. PWC reports a 69.7% increase in plug-in hybrid electric vehicle (PHEV) sales last quarter compared to Q1 2023 and S&P Global announced 75% growth in new PHEV registrations in Canada for the first four months of 2024. Claims frequency for hybrid vehicles has also increased. Repairable PHEVs represented 0.83% of Q1 2024 collision claims in the U.S. and 1.28% in Canada. This is up 2% and 27% respectively over Q2 2023. Mild hybrid electric vehicles (MHEVs), which combine an internal combustion engine (ICE) with a small electric battery, saw claims frequency of 3.8% in the U.S. and 3.49% in Canada last quarter. While claims frequency remained flat in the U.S., it increased 28% in Canada compared to Q2 2023.
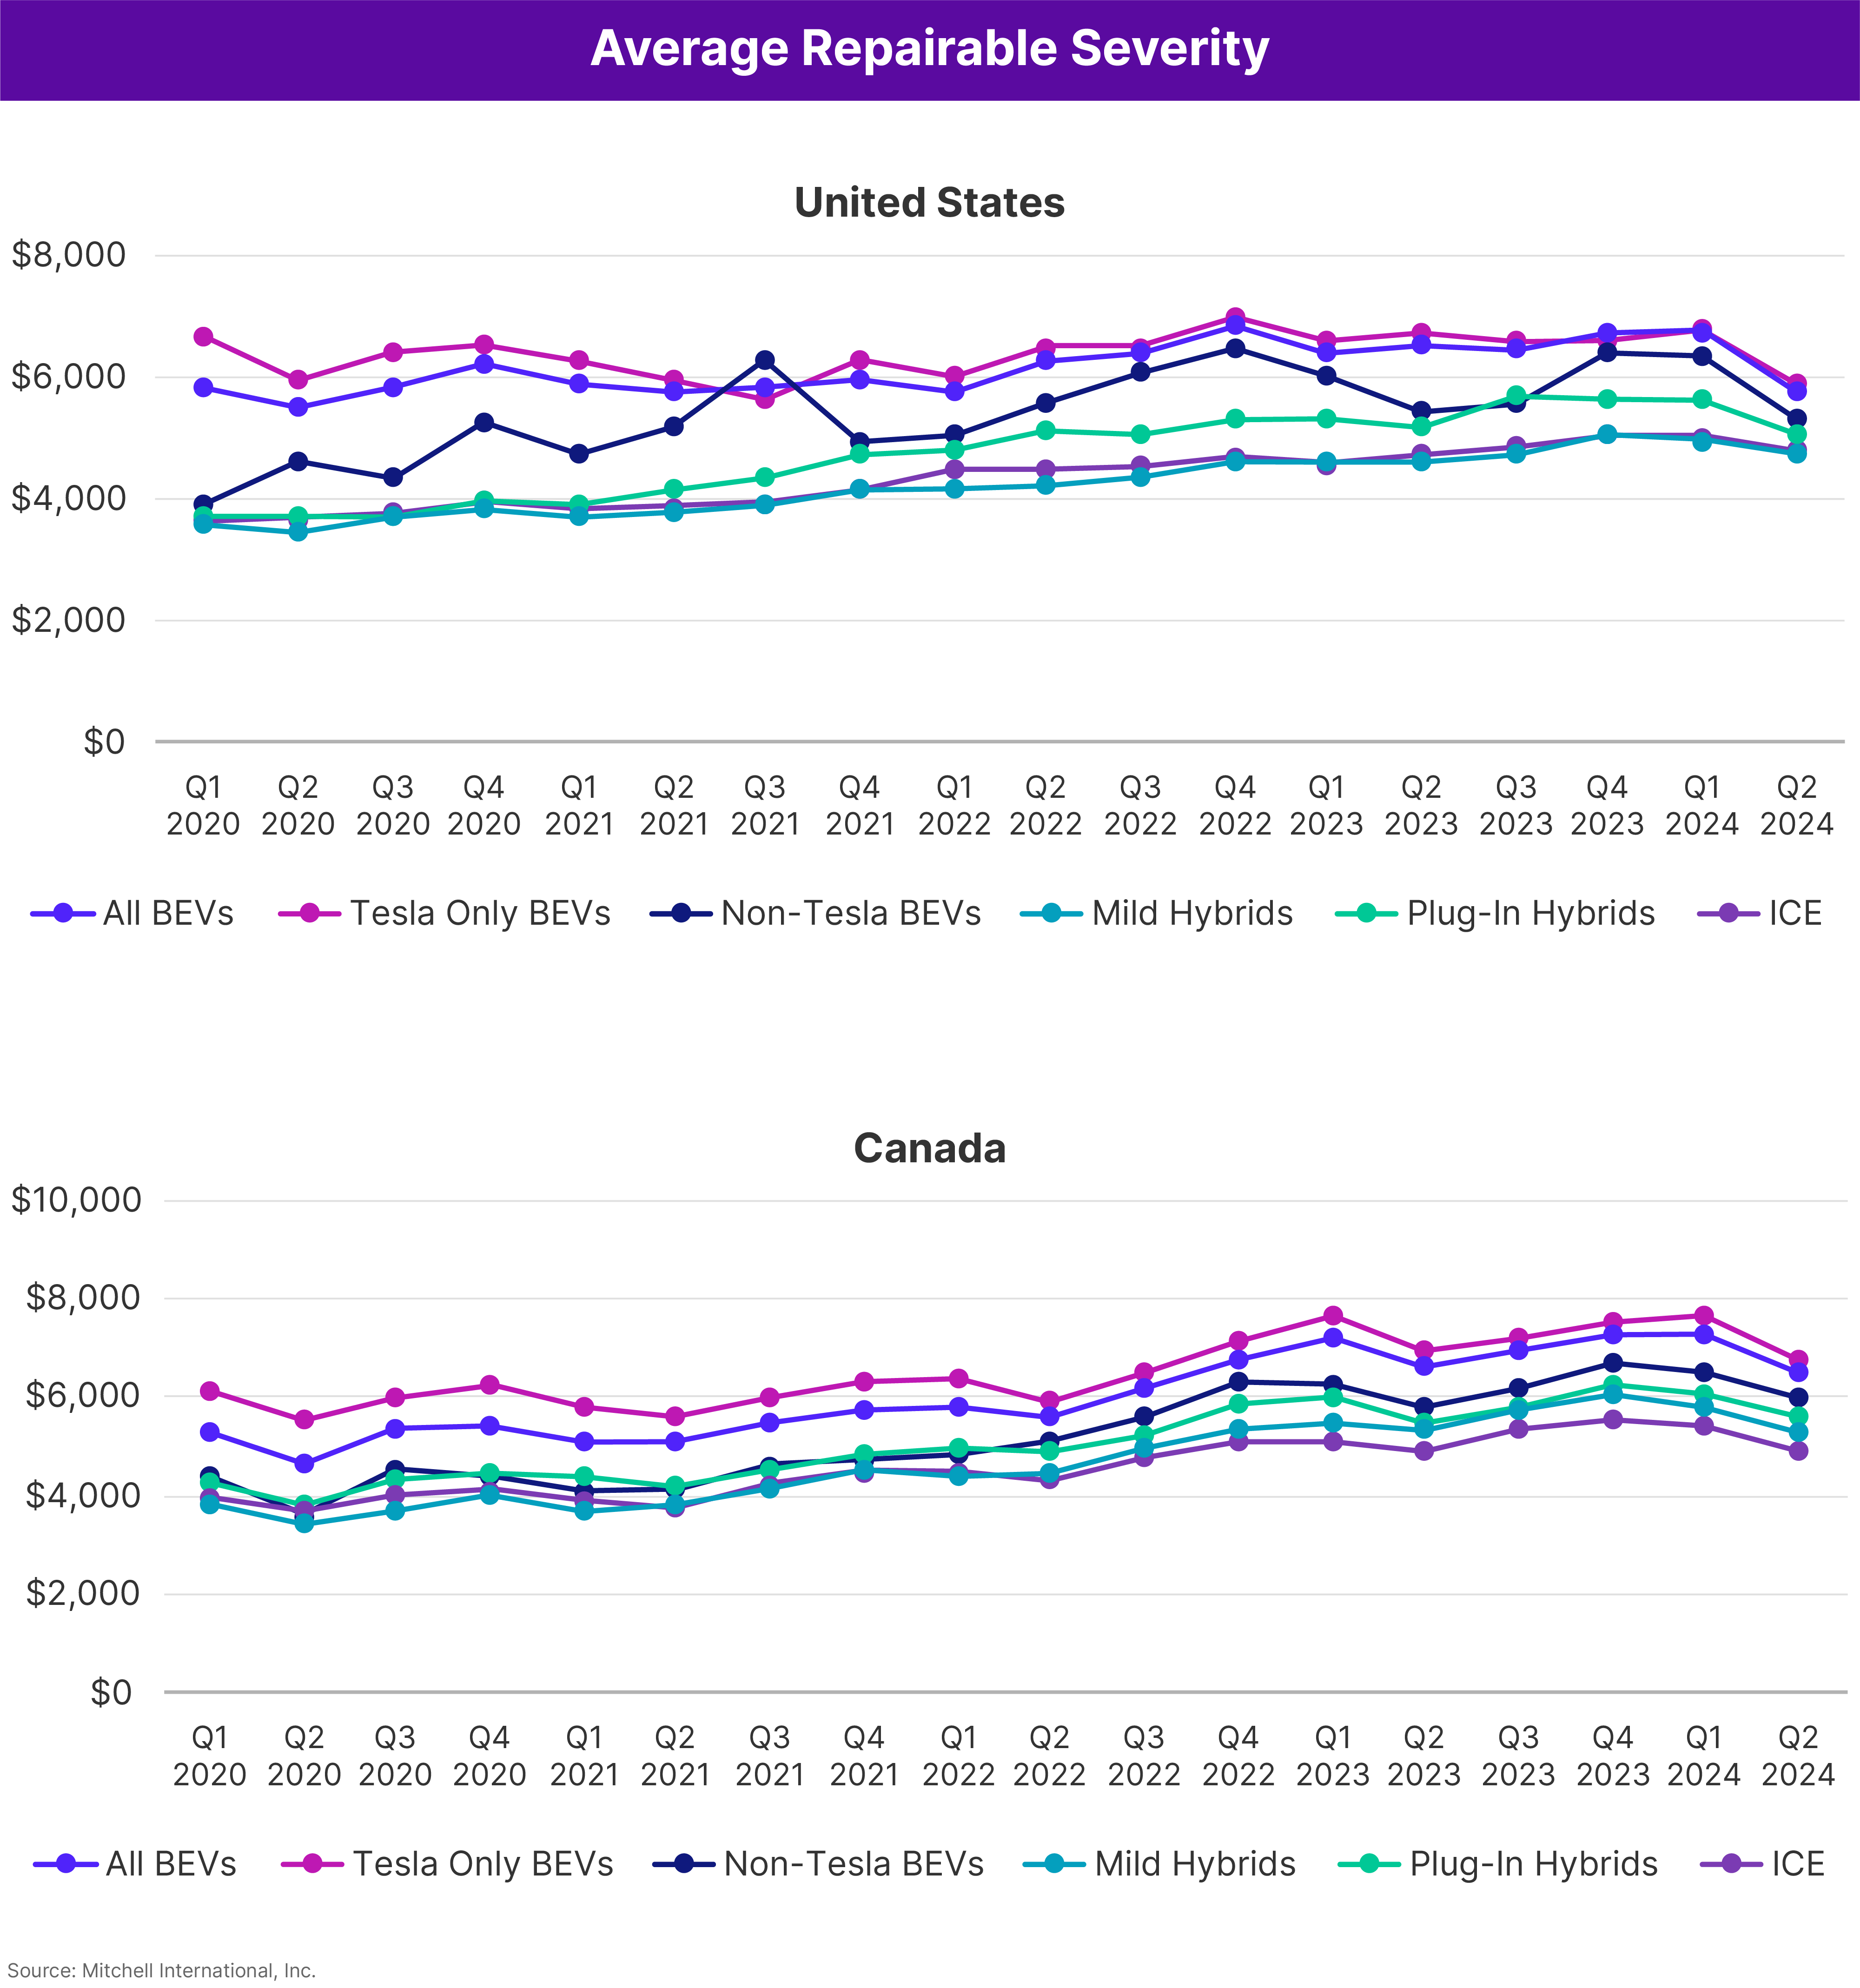
When it comes to average claims severity, mild hybrids are comparable to ICE vehicles in the U.S., having 2% higher severity based on estimatics data from the first half of 2024. However, in Canada, they are 7.5% costlier to repair. This is due to the average age difference between mild hybrids and ICE vehicles in both countries. Canadian mild hybrids are 1.18 model years newer than U.S. mild hybrids while the average age of ICE automobiles is nearly identical. Plug-in hybrids—which rely on a larger, high-voltage battery as the primary propulsion source and also feature a secondary, internal combustion engine—exhibit a greater severity delta compared to the ICE population (12.5% in the U.S. and 13.7% in Canada) due to their close similarity to BEVs.
“In the U.S., Q2 average claims severity for repairable BEVs was $5,753 and $4,806 for ICE automobiles, a difference of $947 or nearly 20%. In Canada, it was $6,534 (CAD) for BEVs and $4,958 (CAD) for ICE-powered alternatives, a difference of $1,576 (CAD) or over 31%.”
Total loss frequency between BEVs and 2021 model year and newer ICE vehicles continues to exhibit striking similarity. U.S. BEVs were totaled at a rate of 9.16% in Q2 2024 (down 8% from Q1 2024 and up 20% from Q2 2023). Canadian BEVs were written off 7.24% of the time (down 3% from Q1 2024 and up 44% from Q2 2023). Newer ICE vehicles—comparable to BEVs in their complexity and cost to repair—totaled at a frequency of 9.45% in the U.S. and 8.52% in Canada. Overall, used vehicle prices in Canada remain higher than in the United States, which explains why a more notable difference exists in that region between EV and ICE total loss frequency.
Although EVs have a higher average number of mechanical labor hours per appraisal, they are less likely than their ICE counterparts to have frame labor present on an estimate (5.21% for EVs versus 8.18% for ICE options). Frame labor is typically flagged when technicians must use a hydraulic frame machine to straighten both full ladder frame components as well as unibody structures. This lower frequency suggests the design of EVs could be more effective at preventing crash energy from damaging the vehicle’s structural components. Although further study is needed to determine the true cause of this delta, this could be one aspect of EV engineering that bodes well for future repairability.
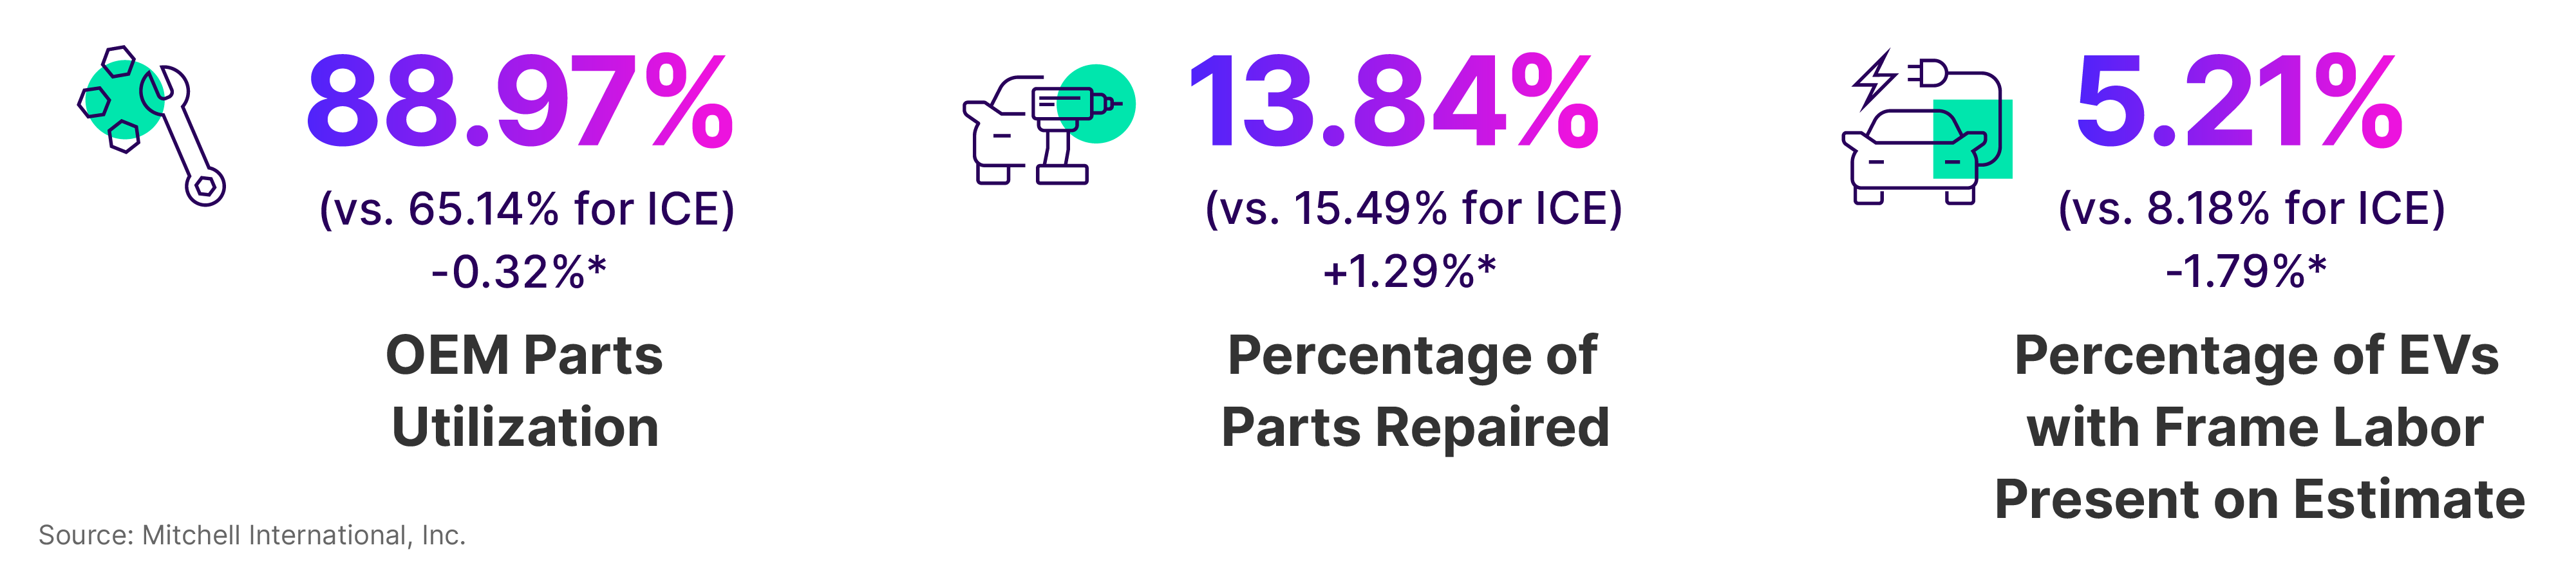
By the Numbers
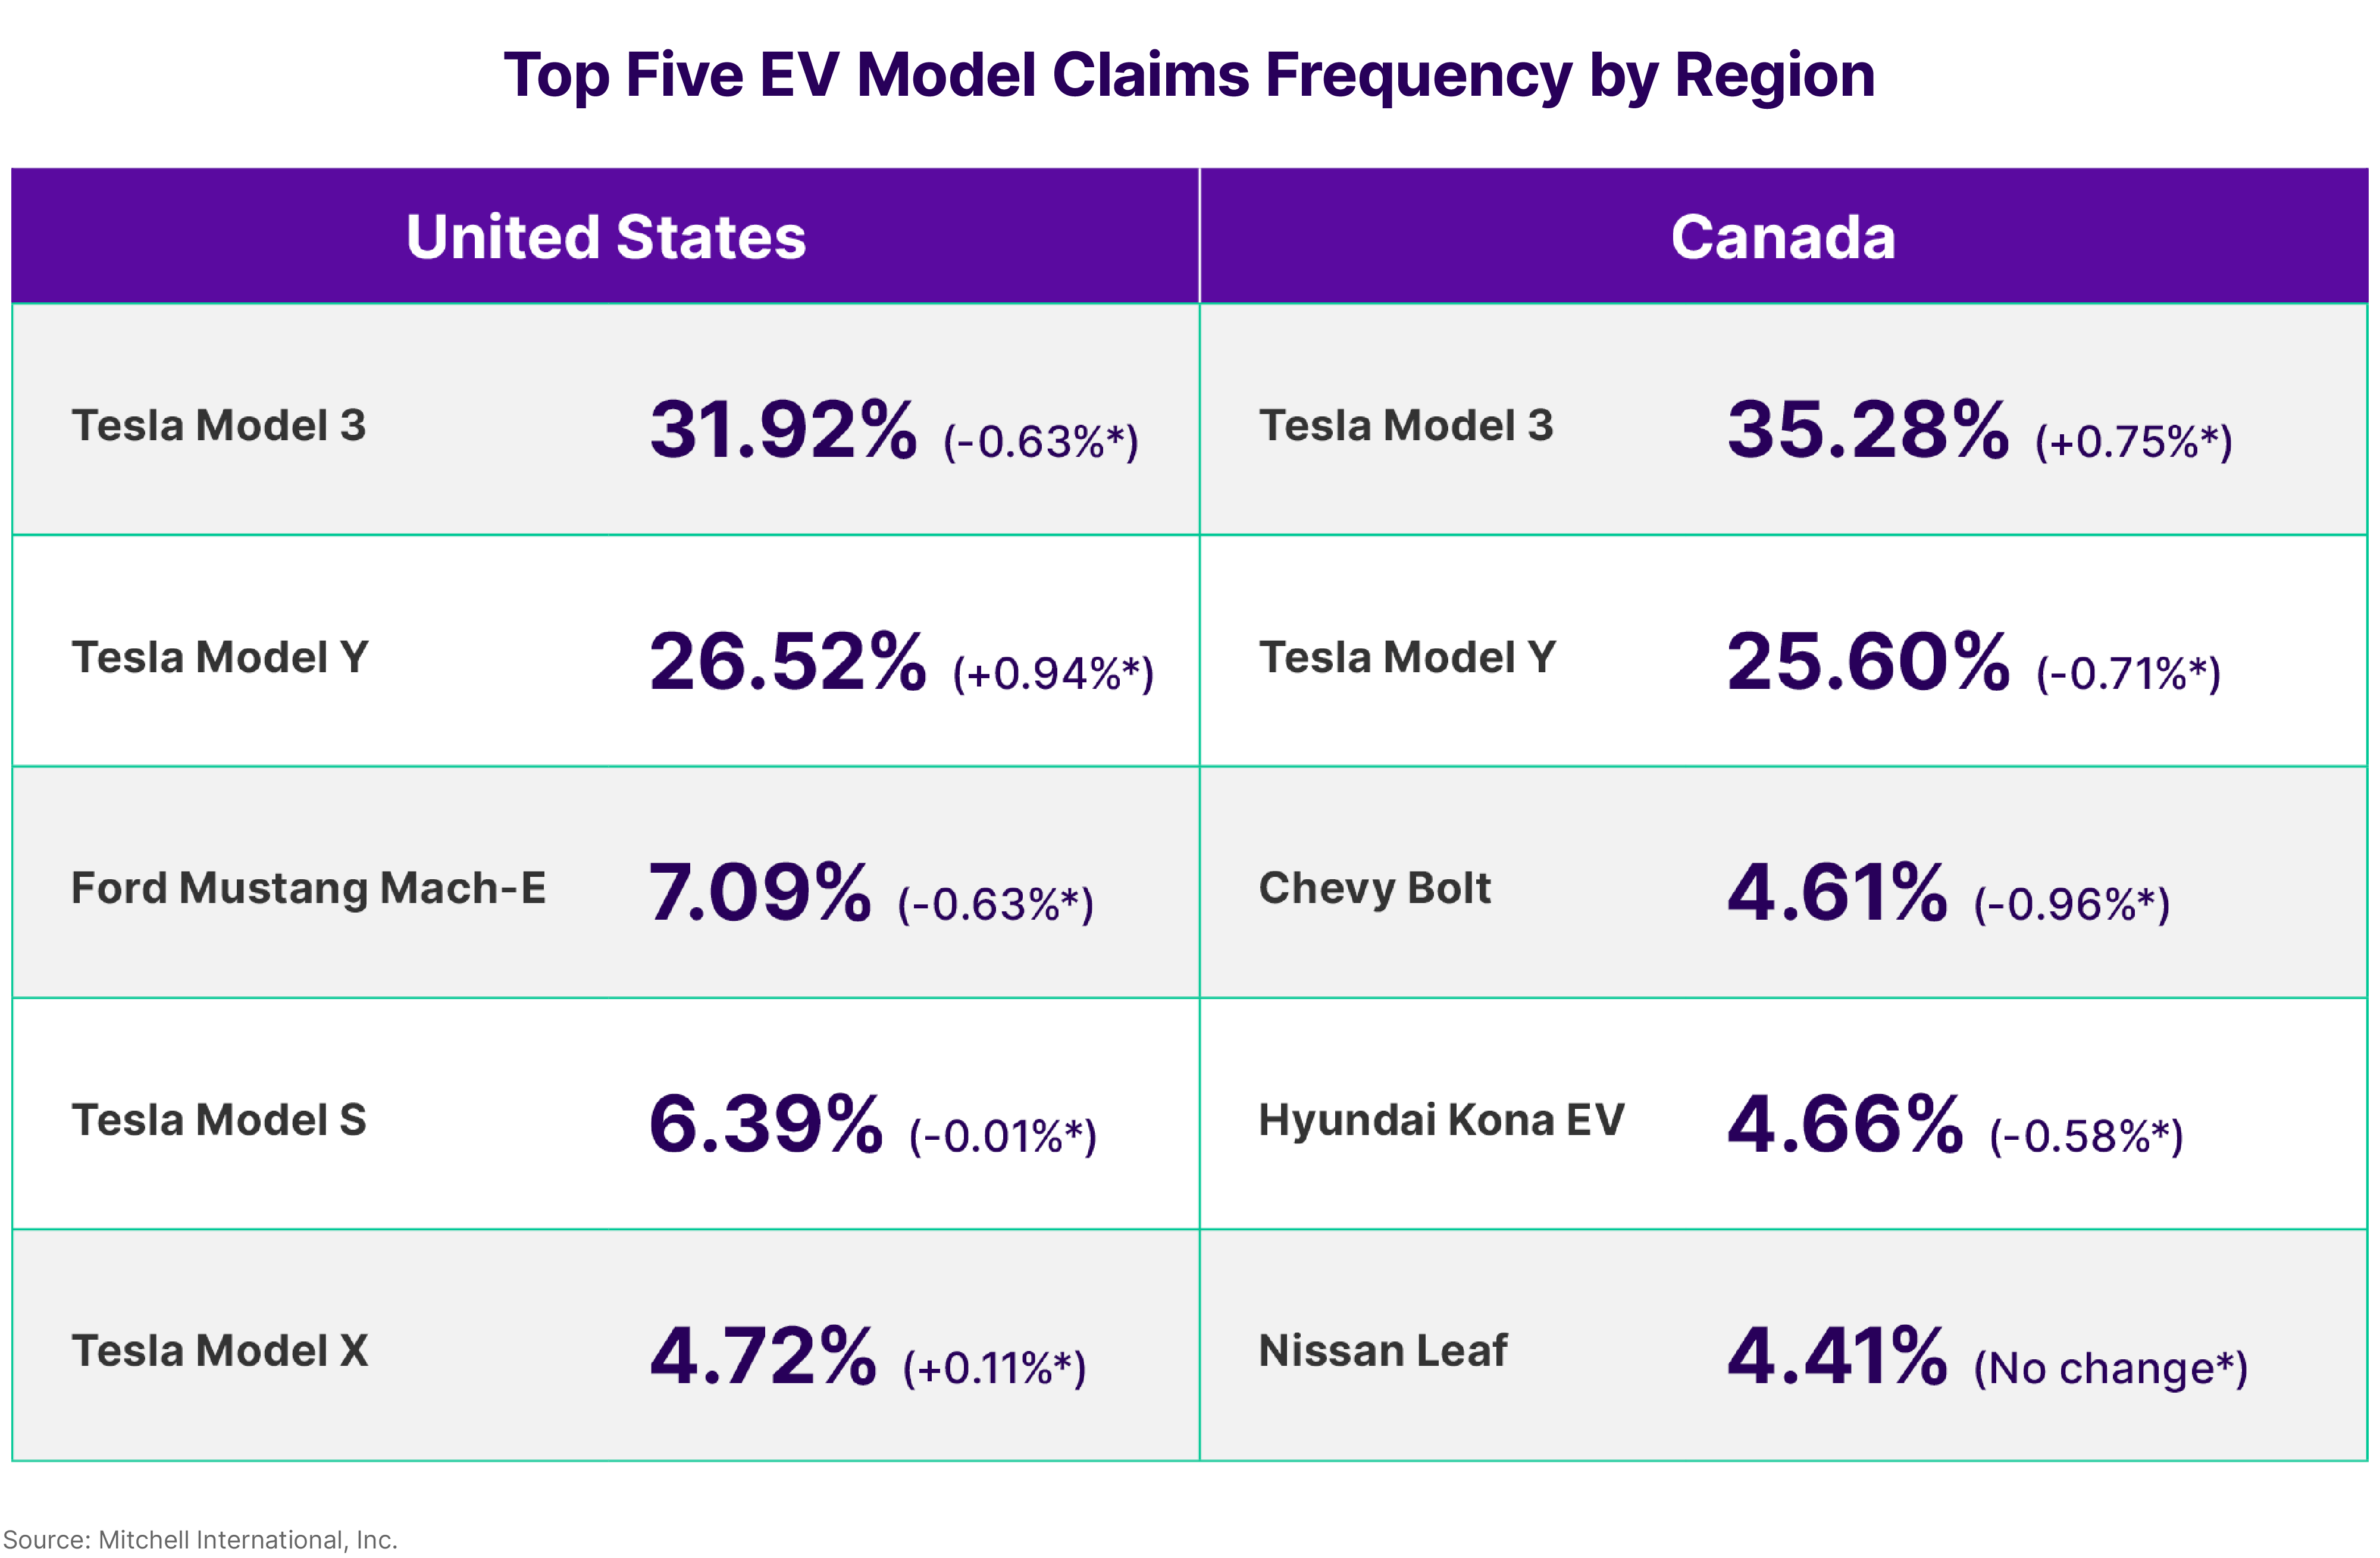
*Difference between Q2 2024 and Q1 2024.
Subscribe Now
To subscribe to future issues of Mitchell's Plugged-In: EV Collision Insights report, please complete the form below.