


Ryan Mandell
Director of Claims Performance, Auto Physical Damage, Mitchell, An Enlyte Company
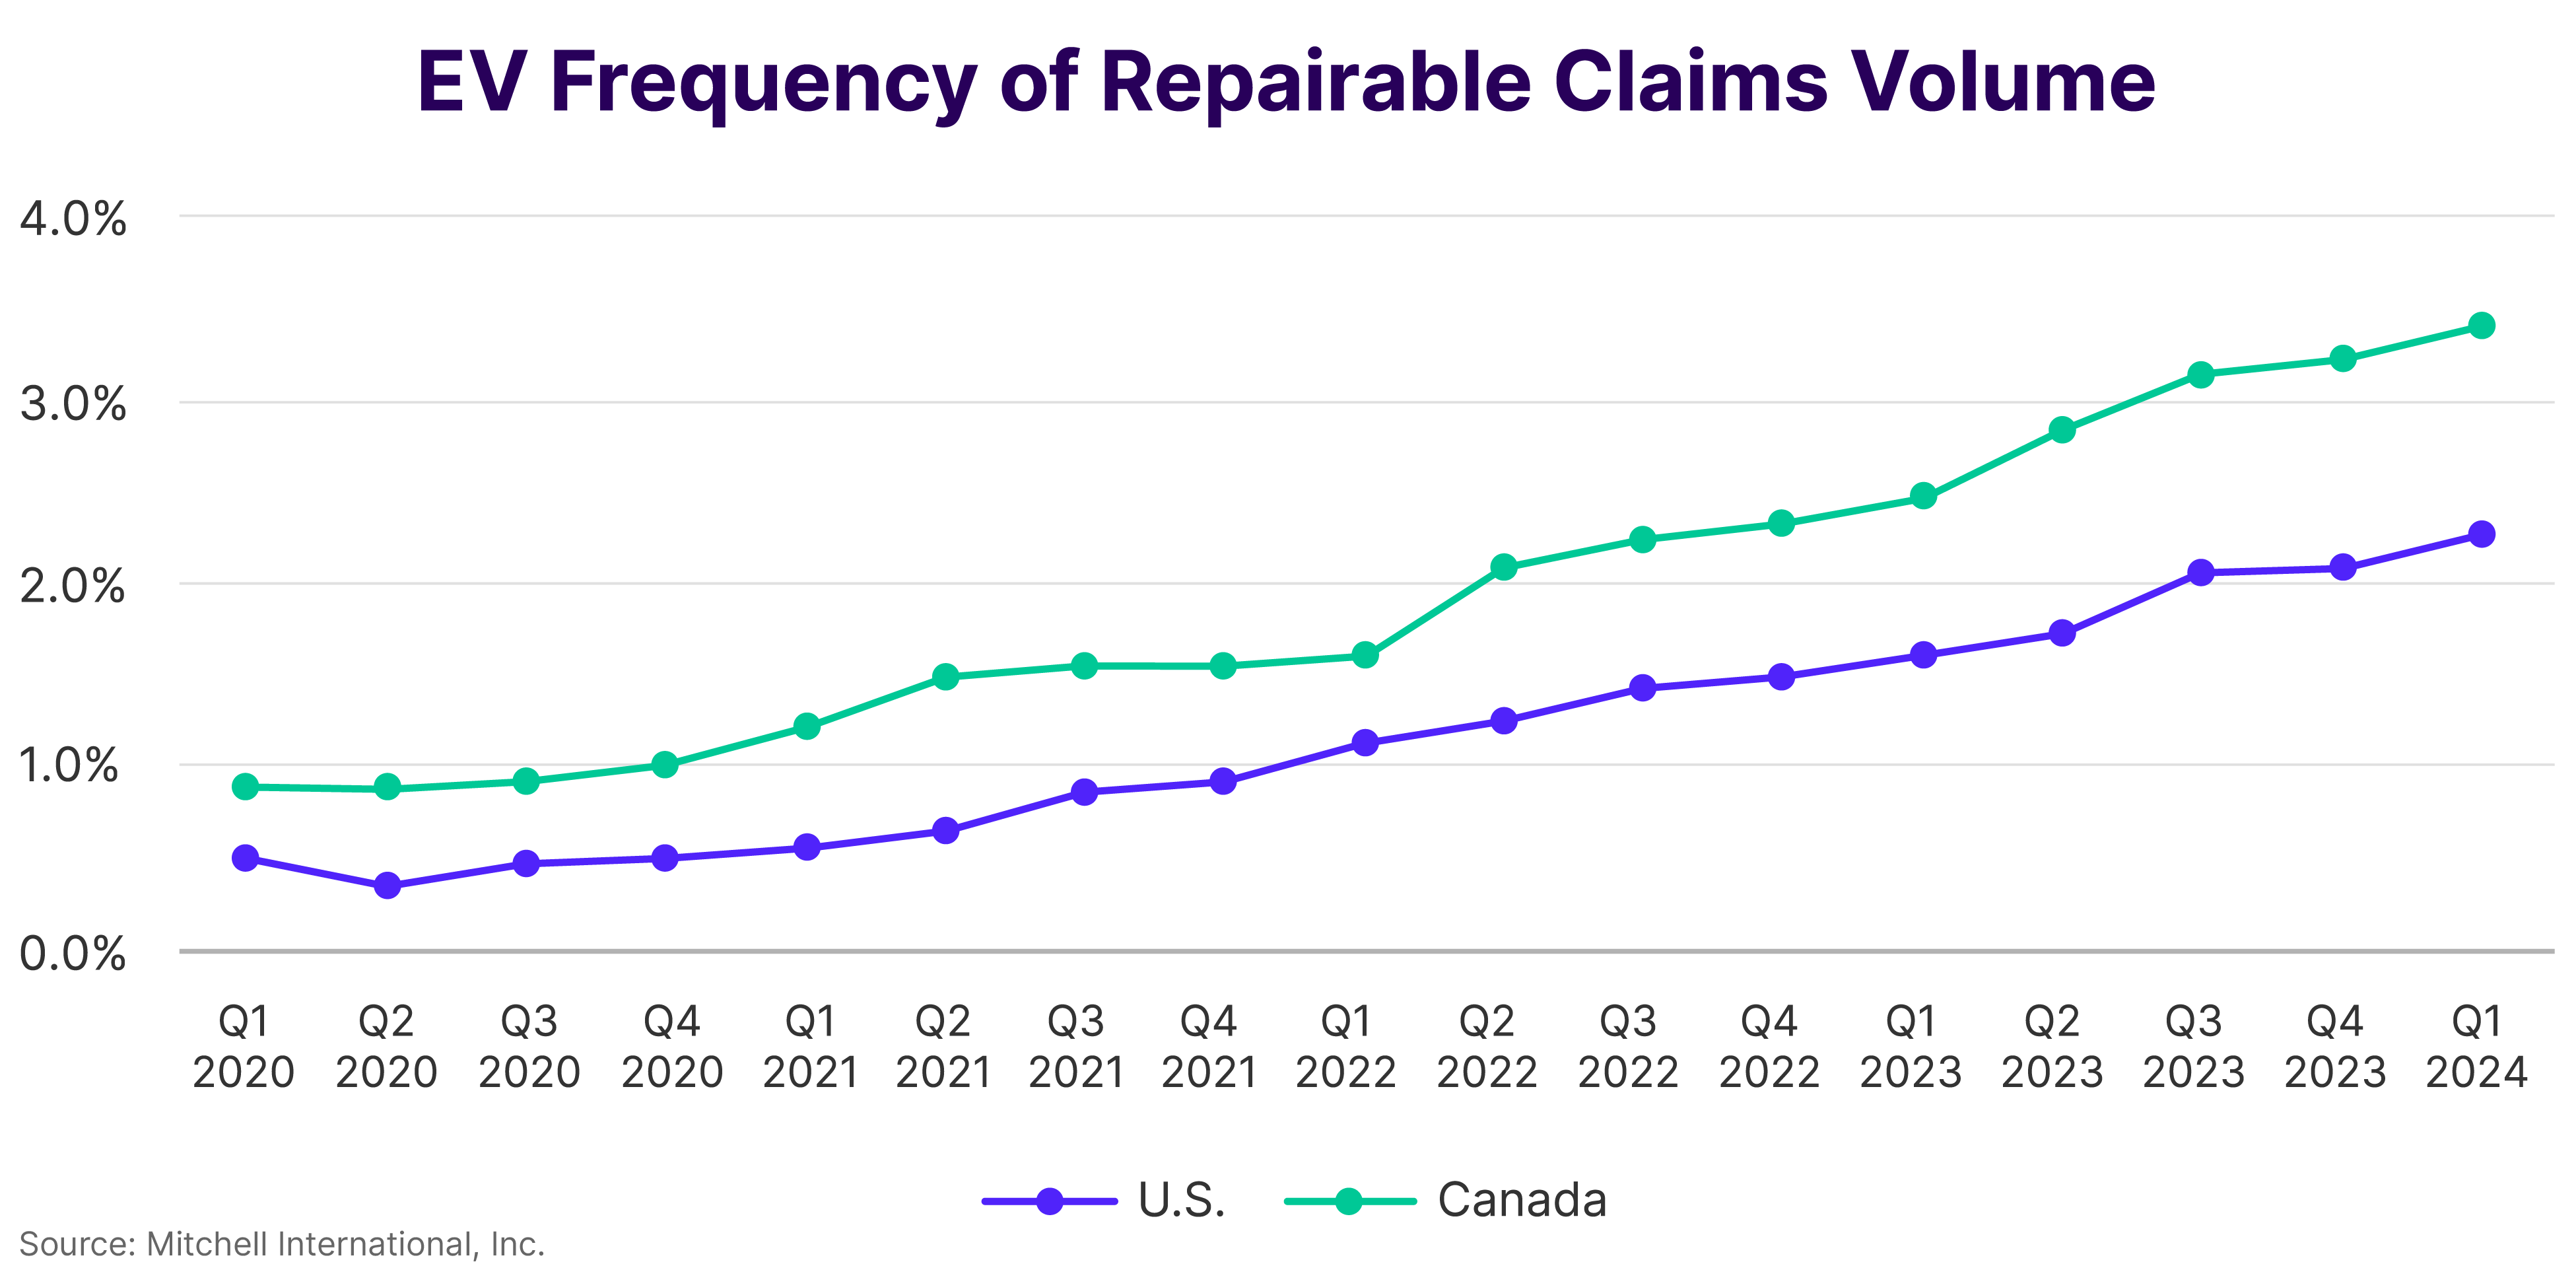
In Q1 2024, electric vehicle (EV) repairable claims frequency rose to 2.26% in the United States and 3.41% in Canada, an increase of approximately 40% and 38% respectively over Q1 2023. Tesla price reductions late last year spurred precipitous price drops throughout the EV segment. As a result, price parity between EVs and vehicles with an internal combustion engine (ICE) may be coming faster than previously predicted. For example, Cox Automotive reported that in the U.S. the “average transaction price at the end of 2023 for a new EV was $50,798, only $2,040 more than a gas-powered vehicle at $48,759”. That same rapid move towards price parity, however, also resulted in weakened consumer confidence in the financial viability of used EVs, with prices falling by more than 30% year over year versus a 3.6% decline for used ICE vehicles.
As EV values decrease, EV total loss frequency has increased. In the U.S., EVs were written off as a total loss 9.93% of the time in Q1 2024 (up 8% from Q4 2023 and 30% from Q3 2023). Canadian EV total loss frequency was 7.48% last quarter (up 7% from Q4 2023 and 29% from Q3 2023). This dramatic rise brings EVs mostly in line with their newer ICE counterparts and, based on the latest claims data, there is no evidence that they are declared total losses at a significantly higher rate than ICE automobiles. In fact, gasoline-powered vehicles 2021 and newer had a similar total loss frequency last quarter—9.51% in the U.S. and 7.44% in Canada.
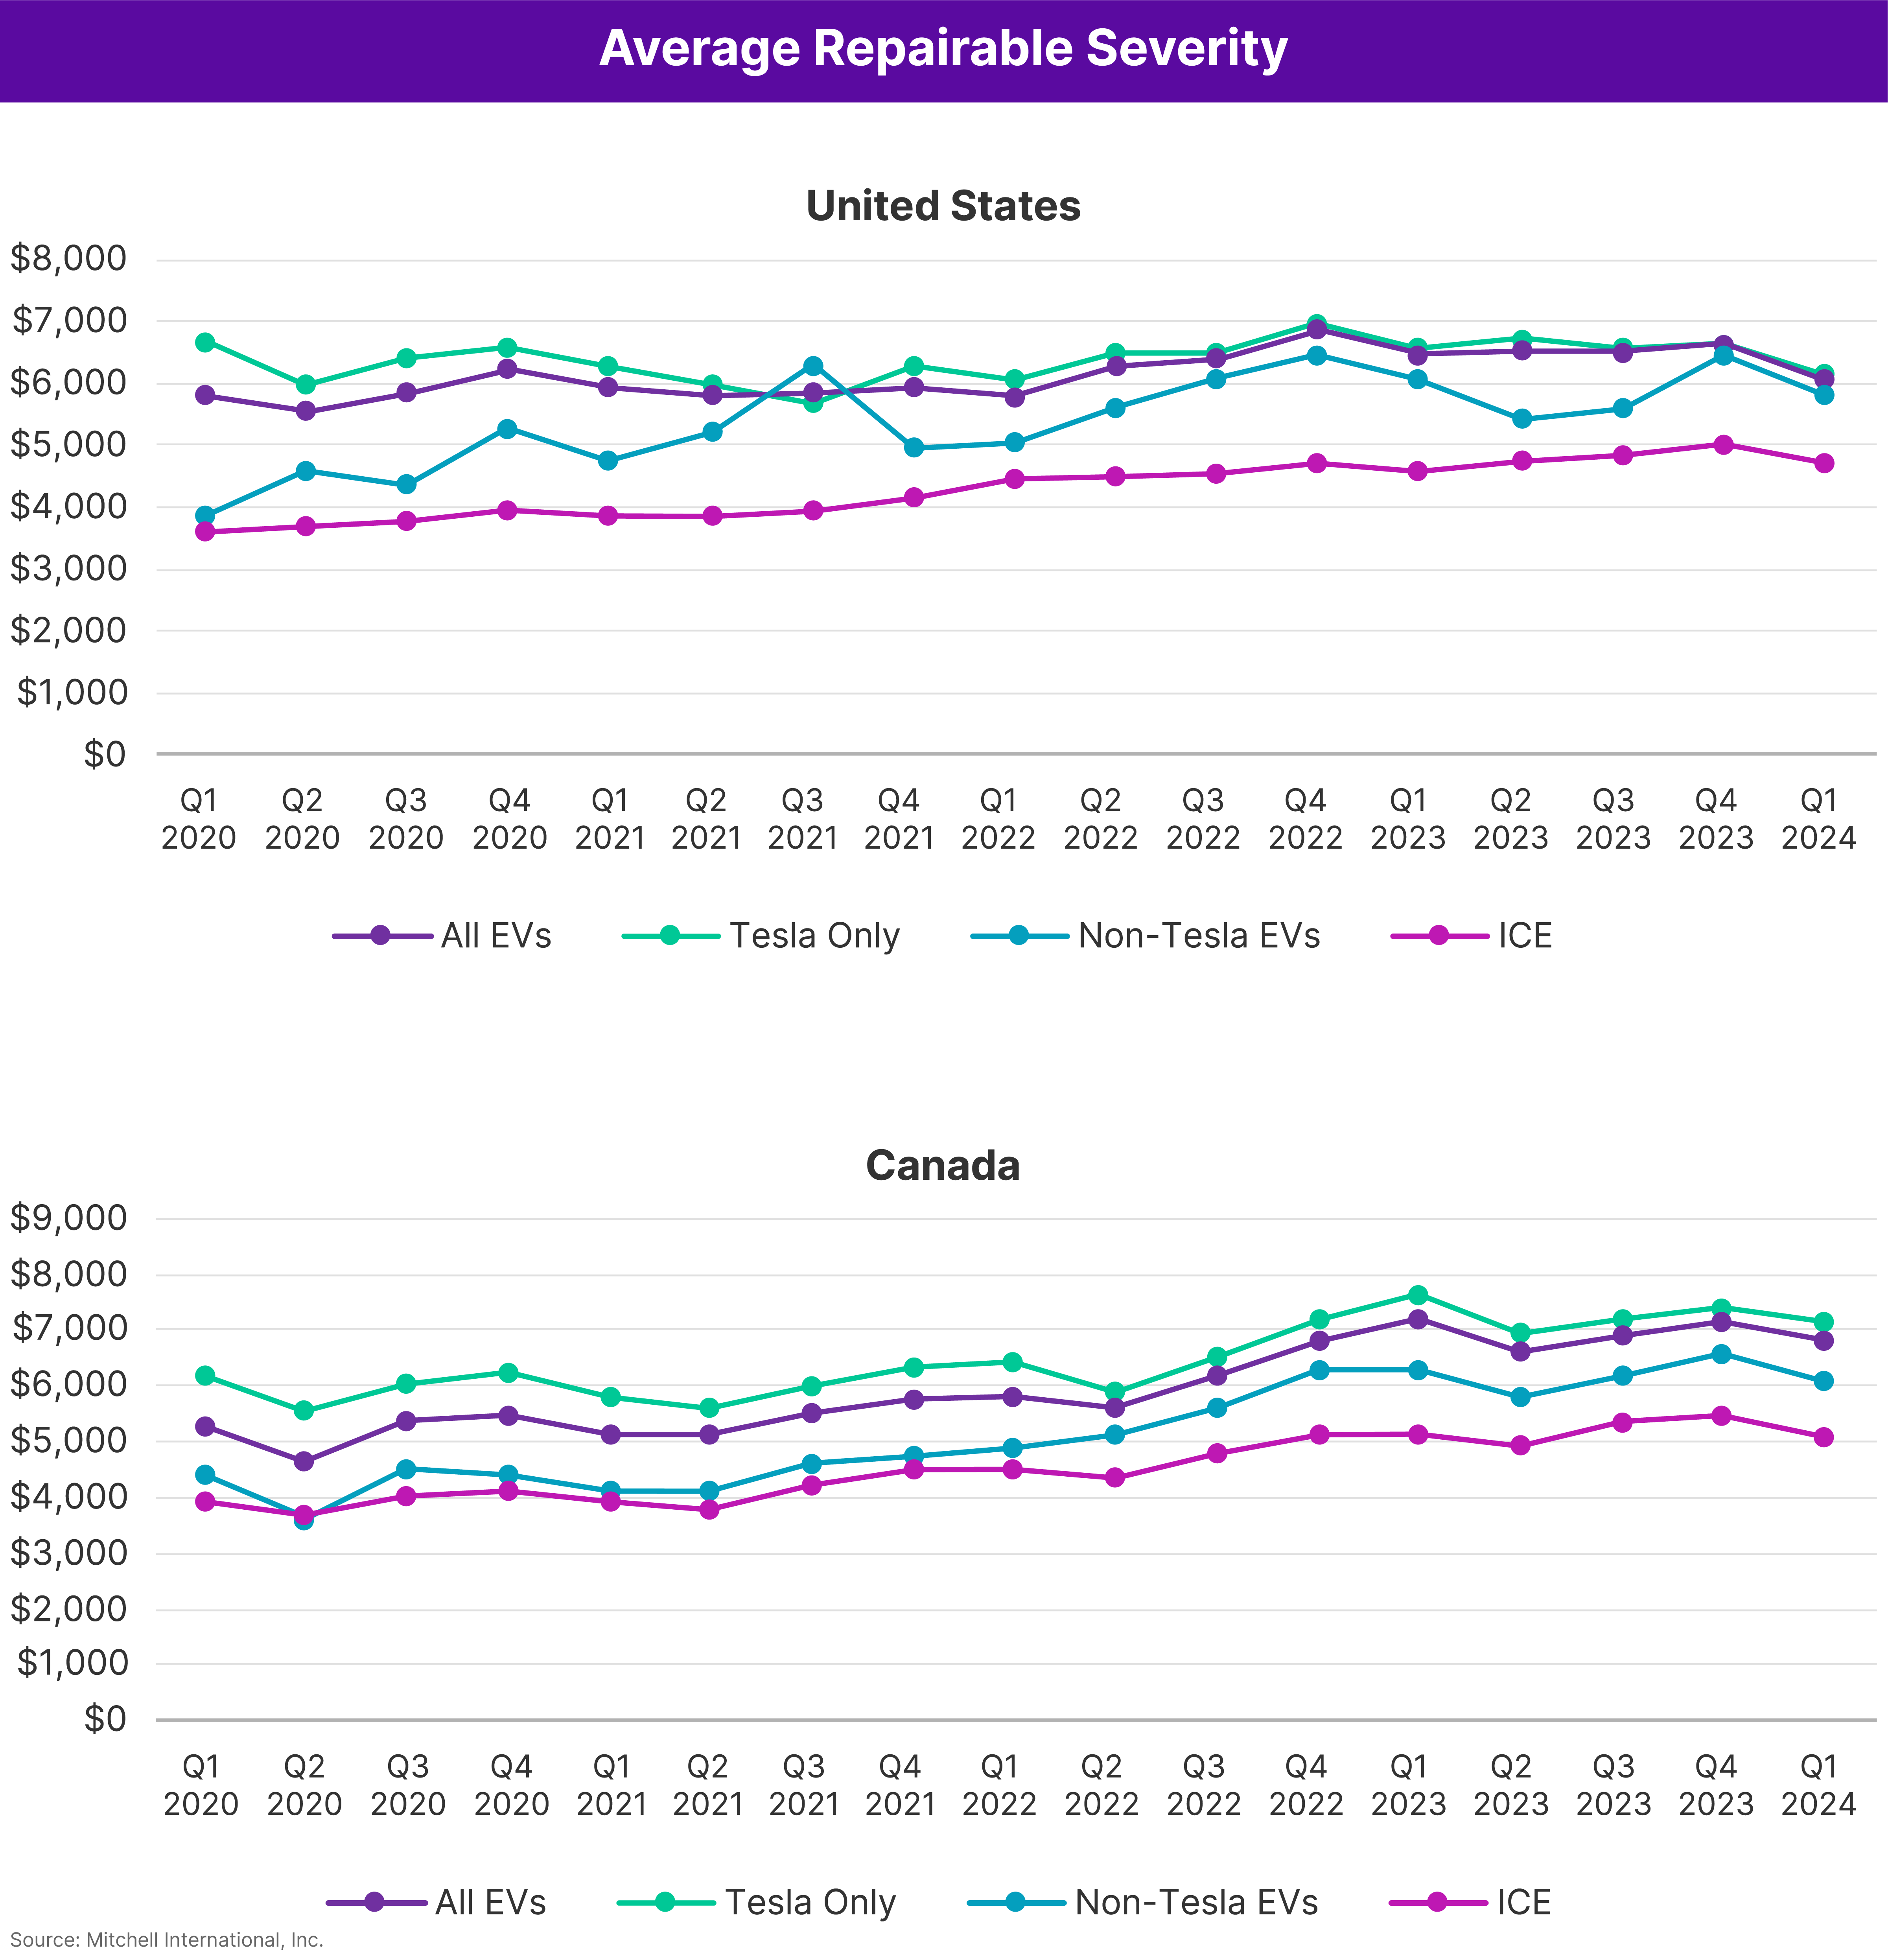
When it comes to repairable vehicles, however, claims severity for EVs continues to exceed ICE automobiles. In Q1 2024, average severity was $6,066 for all EVs—including Tesla models—and $4,703 for ICE vehicles in the U.S., a difference of $1,363 or 29%. In Canada, average severity was $6,810 (CAD) for all EVs and $5,110 (CAD) for ICE alternatives, a difference of $1,700 (CAD) or 33%.
“In the U.S., EVs were written off as a total loss 9.93% of the time in Q1 2024 (up 8% from Q4 2023 and 30% from Q3 2023). Canadian EV total loss frequency was 7.48% last quarter (up 7% from Q4 2023 and 29% from Q3 2023).”
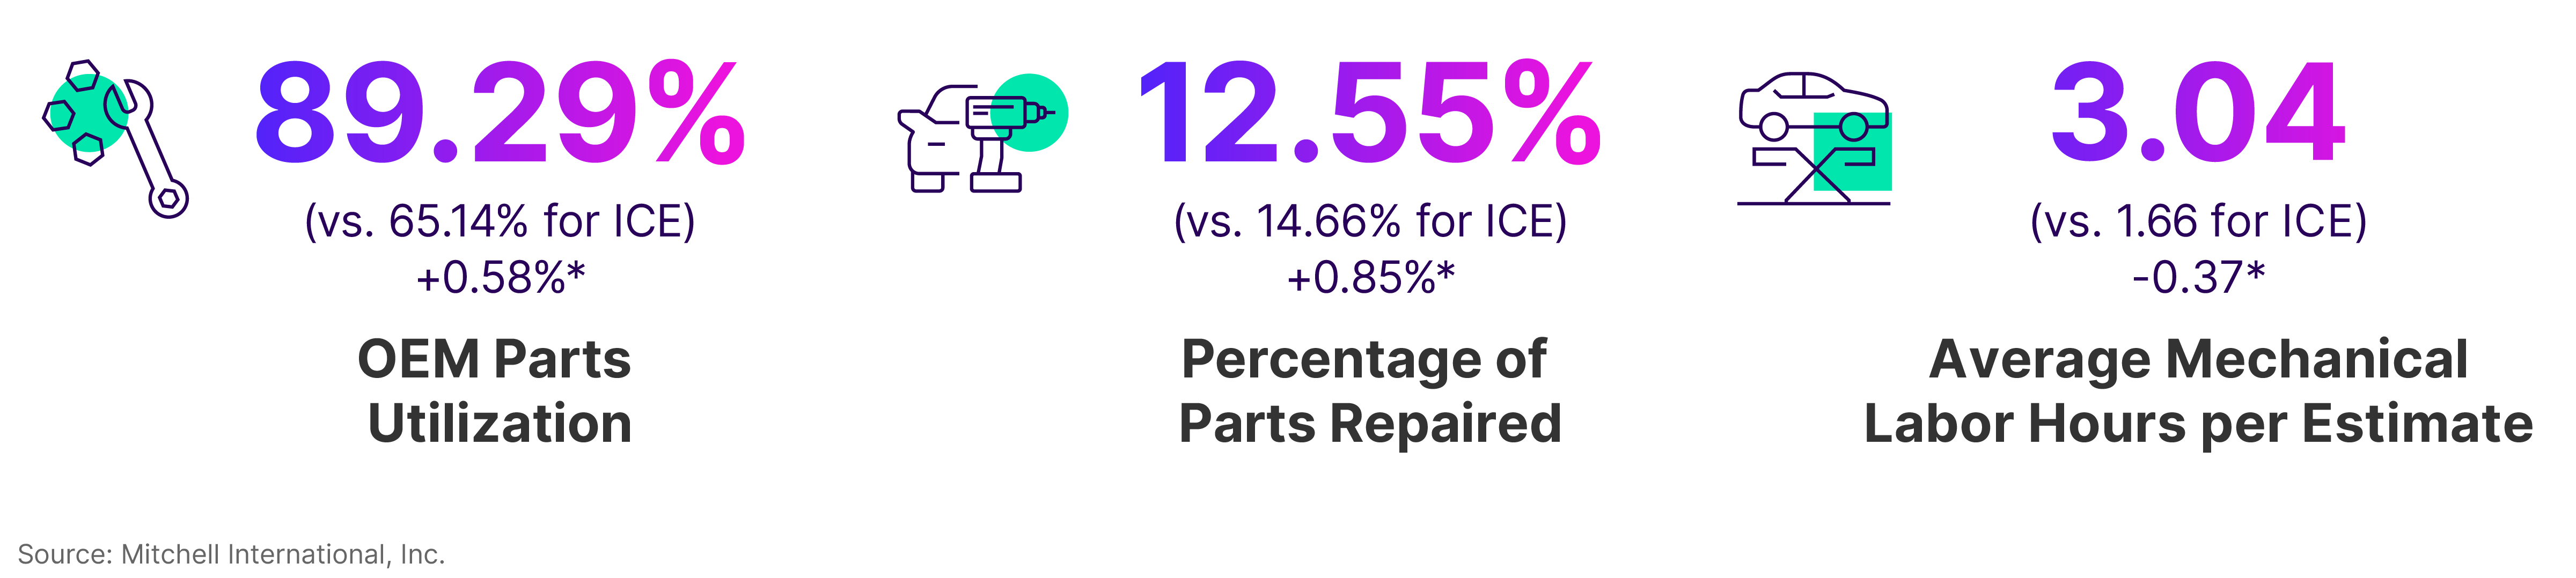
The disparity between EVs and ICE alternatives is also evident when comparing mechanical labor hours present on estimates for repairable vehicles. The number of hours for EVs is significantly higher—3.04 compared to 1.66. With the average mechanical labor rate for both the U.S. and Canada exceeding $100 per hour, this additional time adds significant cost to EV repairs. The extra EV labor hours are likely due to the management of the high-voltage battery, which requires de-energization and often complete removal to protect it during collision repair and refinishing processes.
In terms of EV adoption, range anxiety continues to be a barrier. However, greater access to more charging points can help allay the concerns of potential new EV buyers. In 2023, Canadian public charging ports increased by 30% and U.S. public charging ports increased by 22% over the previous year. Also influencing adoption is the cost of fuel. Several financial institutions and the U.S. Energy Information Administration raised their crude oil price targets for the second half of 2024—some expecting the average price per barrel to surpass $100 by year end. If prices at the pump continue to rise, more consumers may again consider an EV for their next vehicle purchase, especially now that exorbitant EV premiums are seemingly a thing of the past.
By the Numbers
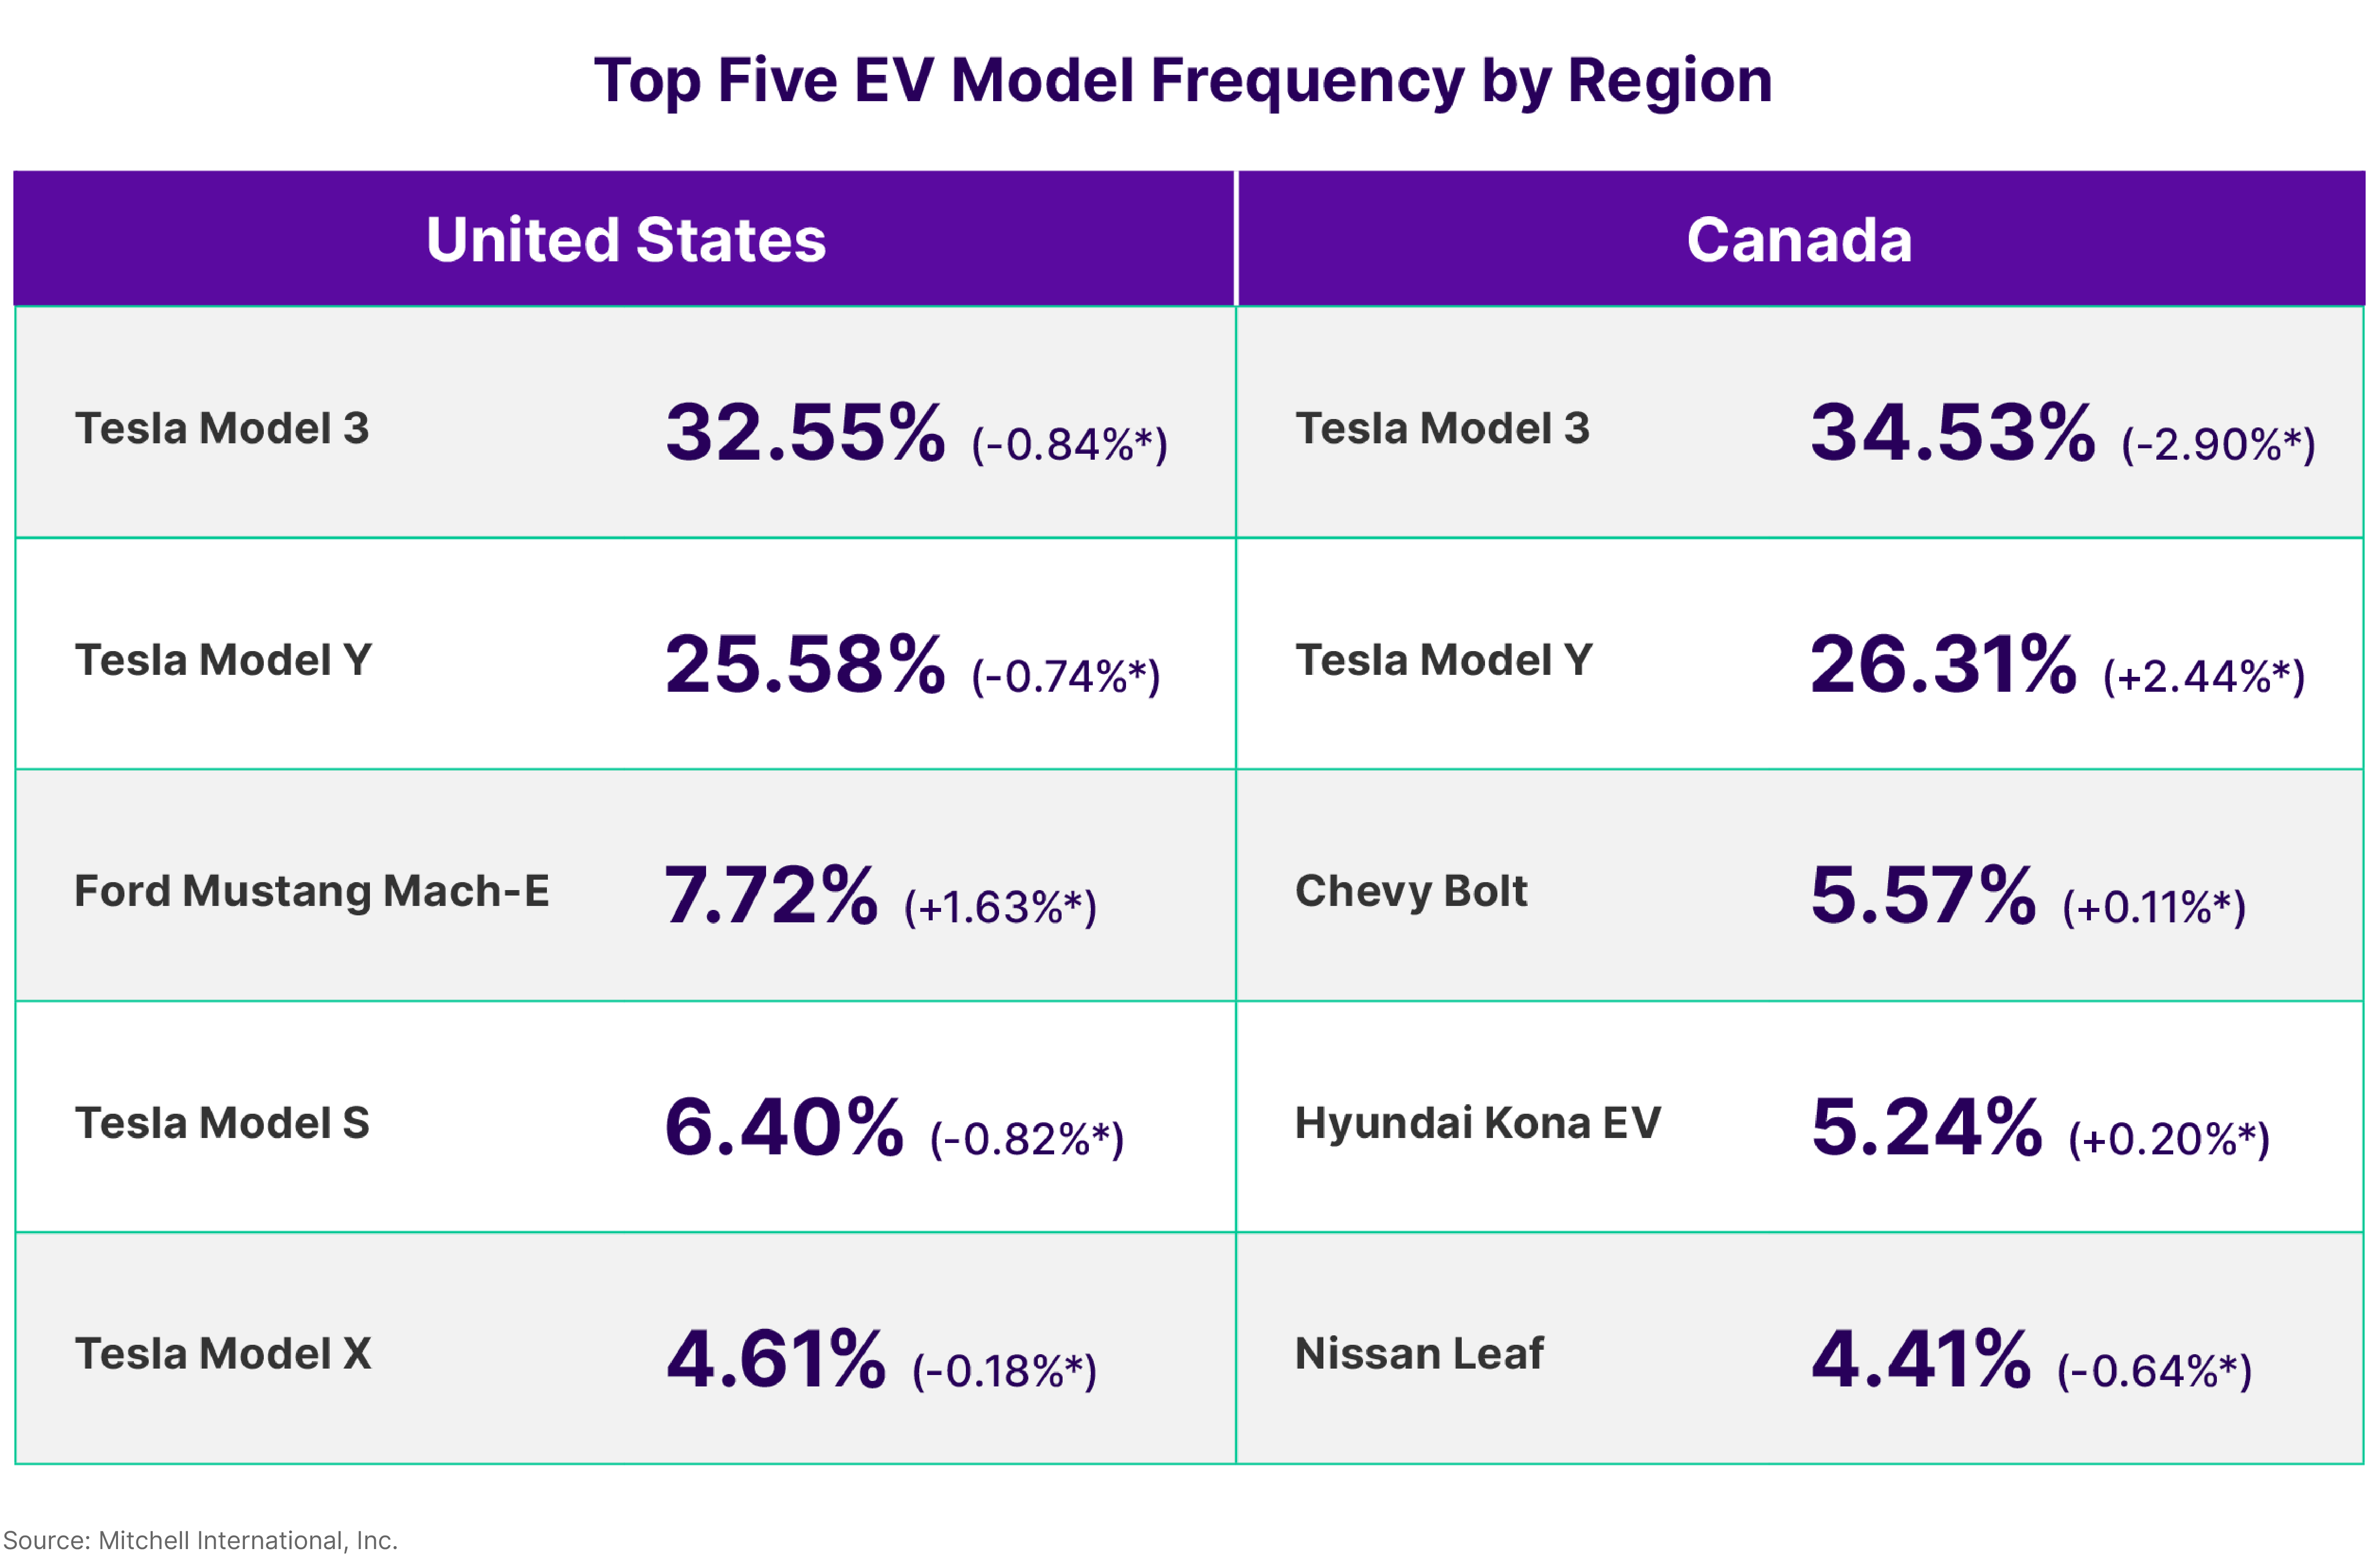
*Difference between Q1 2024 and Q4 2023.
Subscribe Now
To subscribe to future issues of Mitchell's Plugged-In: EV Collision Insights report, please complete the form below.